Happy Thanksgiving,
It is time for the Weekend Review. We’re going to do this a little differently because we’ve had a ridiculous push to the upside. We had a ferocious push of over 350 points last week.
I want to look at every angle—VIX, SPX, and ES—to give you the best analysis possible. We have gained on the Weekly on SPX and the Daily on ES. We haven’t lost on the Weekly on either. This looks like we are going to continue to try to make all-time highs; the question is how they do it and what we buy in the meantime.
I would expect a little relief on Monday/Tuesday. They need to rotate a little bit, but we will see what the day brings.
🧠 Current Market Context
We have witnessed a massive move where we “swept liquidity, played some areas, and boom—back at the highs like magic.” The bulls have accomplished a major feat:
SPX Weekly Gain: SPX closed the weekly above the leg down. It technically never lost support.
ES Daily Gain: ES has gained on the daily timeframe.
VIX Crush: VIX has been selling off “something insane.”
However, we are at a big structure spot up here around 6883.00 on ES & 6845 SPX. It wouldn’t surprise me to get a “smack” from this area, especially knowing where VIX is right now. My bias is long (”I’m in long mode”), but I am looking to buy support on the way up, specifically into the 6765.00 area.
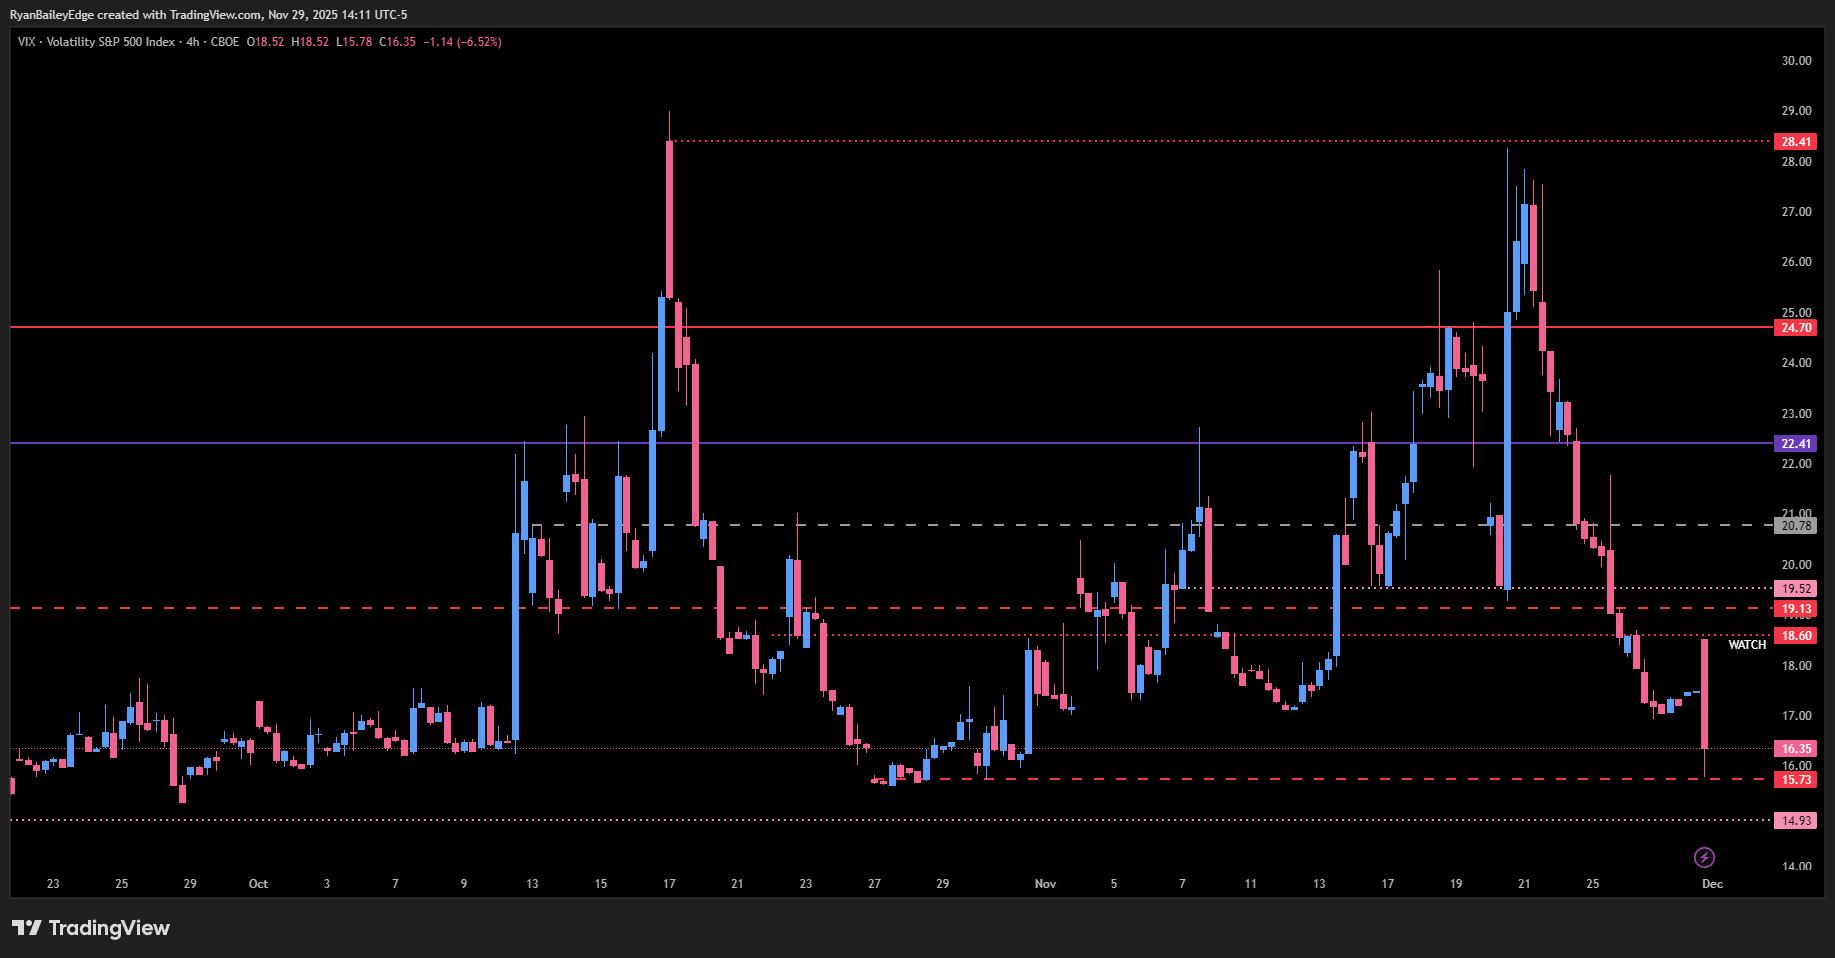
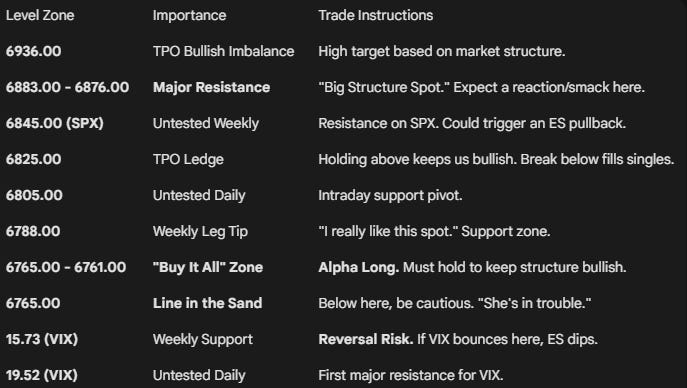
🚨 VIX Analysis: The Reversal Danger
VIX is always on my mind. Right now, VIX is pretty far down here. Every time we get into this territory, we start to get a pop.
The Lows: We retested the significant weekly at 15.73. We have untested areas lower at 14.93 and 12.77, but I don’t think it gets down there without a reaction first.
The Risk: If we get a sweep underneath 15.73 and start to reclaim, be conscious of a reversal.
Resistance (Headwinds for Equities): The first untested level is the daily at 19.52. This is above our significant weekly at 19.13. A push up to here would pressure the indices.
The Biggie: The monthly at 22.41 is the major ceiling.
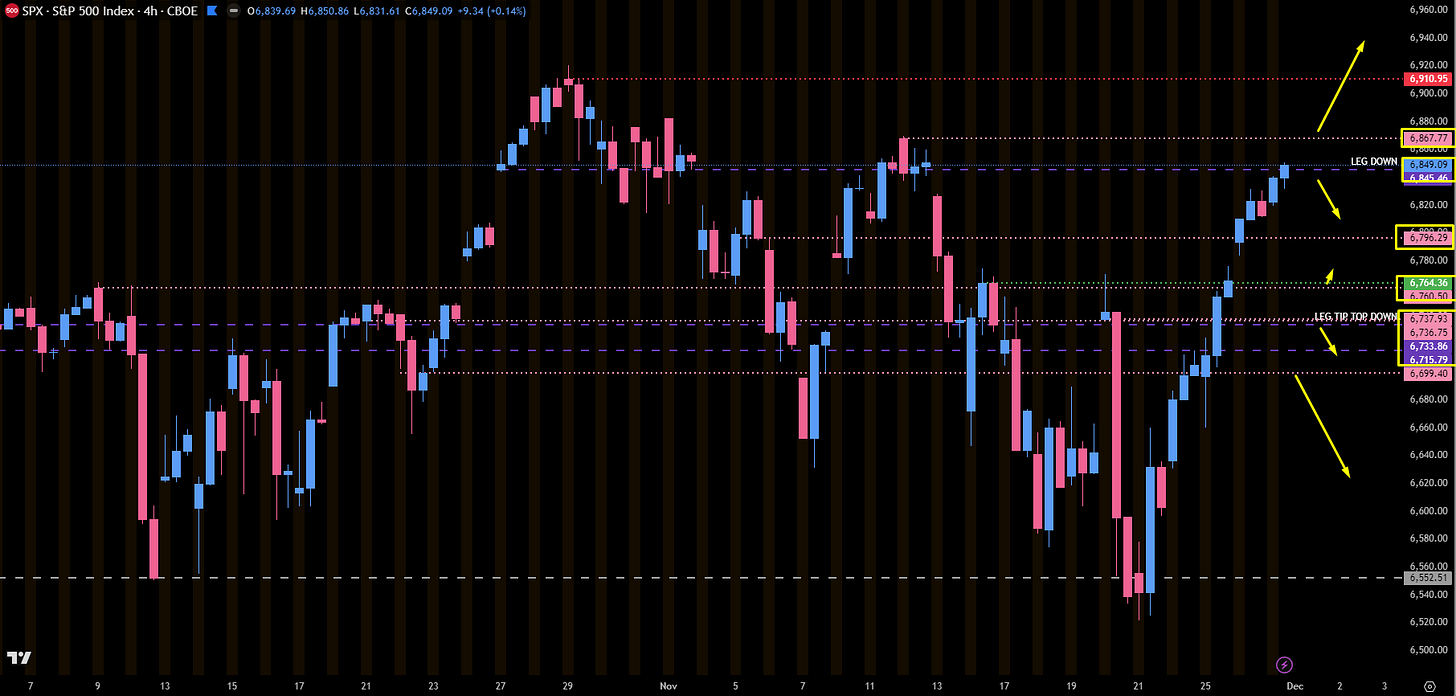
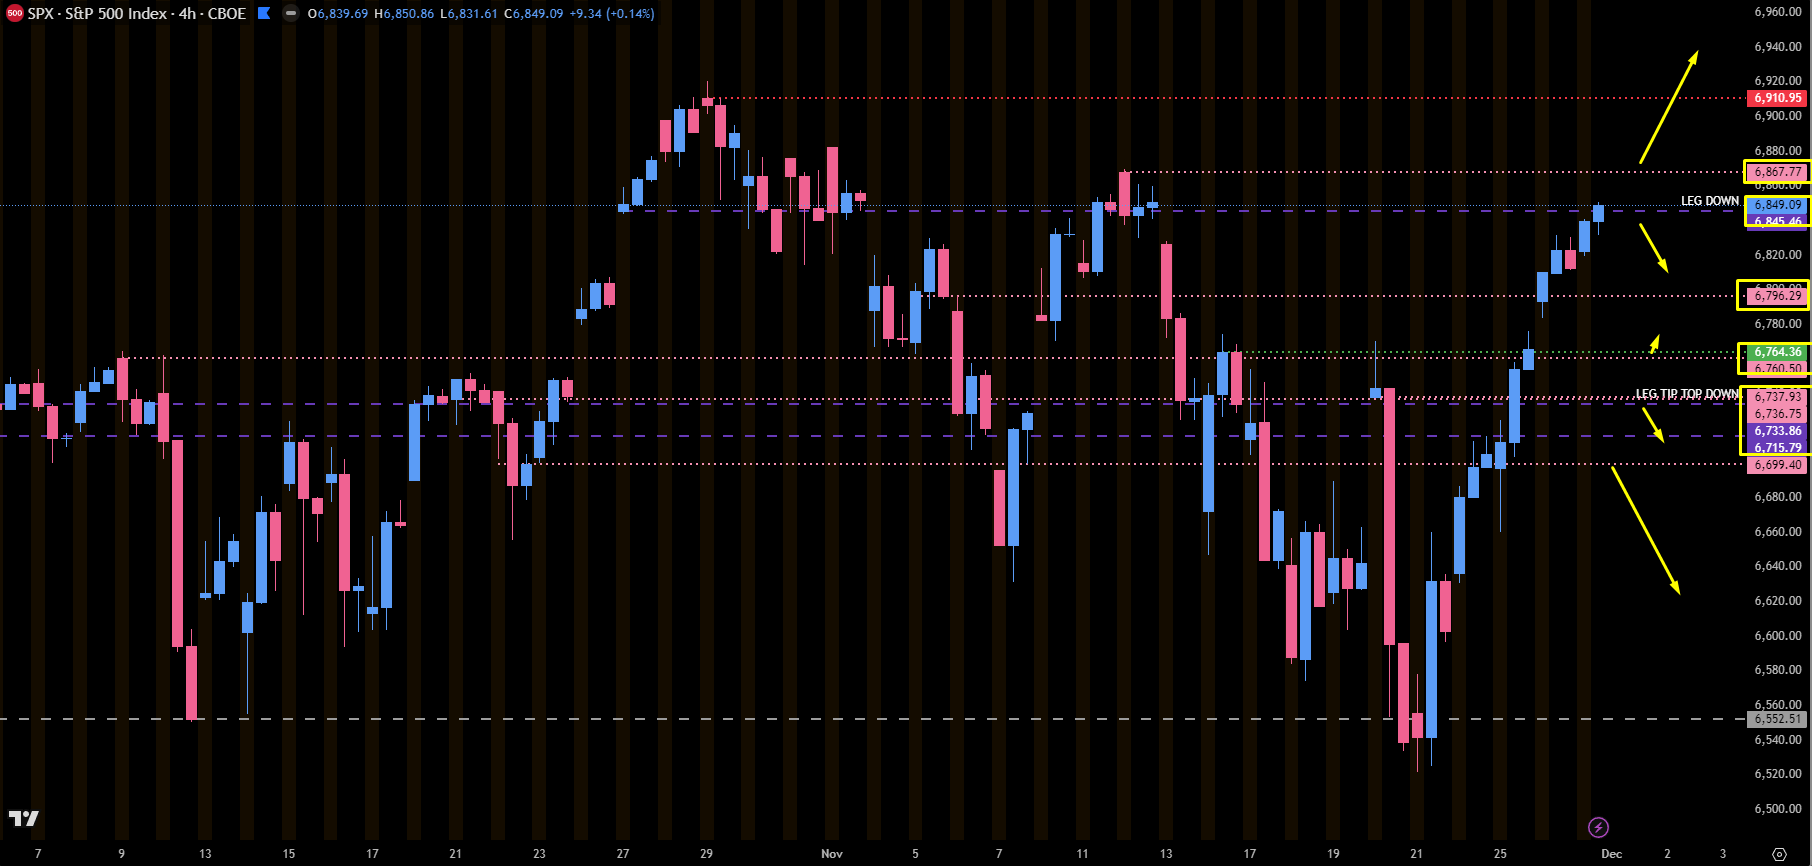
📈 SPX Analysis: Super Bullish Structure
SPX is looking super bullish—so bullish that they closed the weekly above the leg down. This means there is a high probability we make new All-Time Highs.
Overhead Resistance: We have an untested daily at 6867.00 and an untested weekly at 6845.00. Just because we didn’t lose 6845.00 doesn’t mean it won’t get a reaction; it could pull us down before propelling us back up.
Key Support (The Buy Zone):
6796.29 - Top down daily from the support on 11/05
6760.00 - 6764.00: The big leg down that took us to the lows (untested) and the 4-Hour/1-Hour level. “Really like this spot.”
6733.00 - 6737.00: The Weekly Leg Tip. We really want to see this hold.
Invalidation: Underneath 6700.00, “she’s in trouble.”
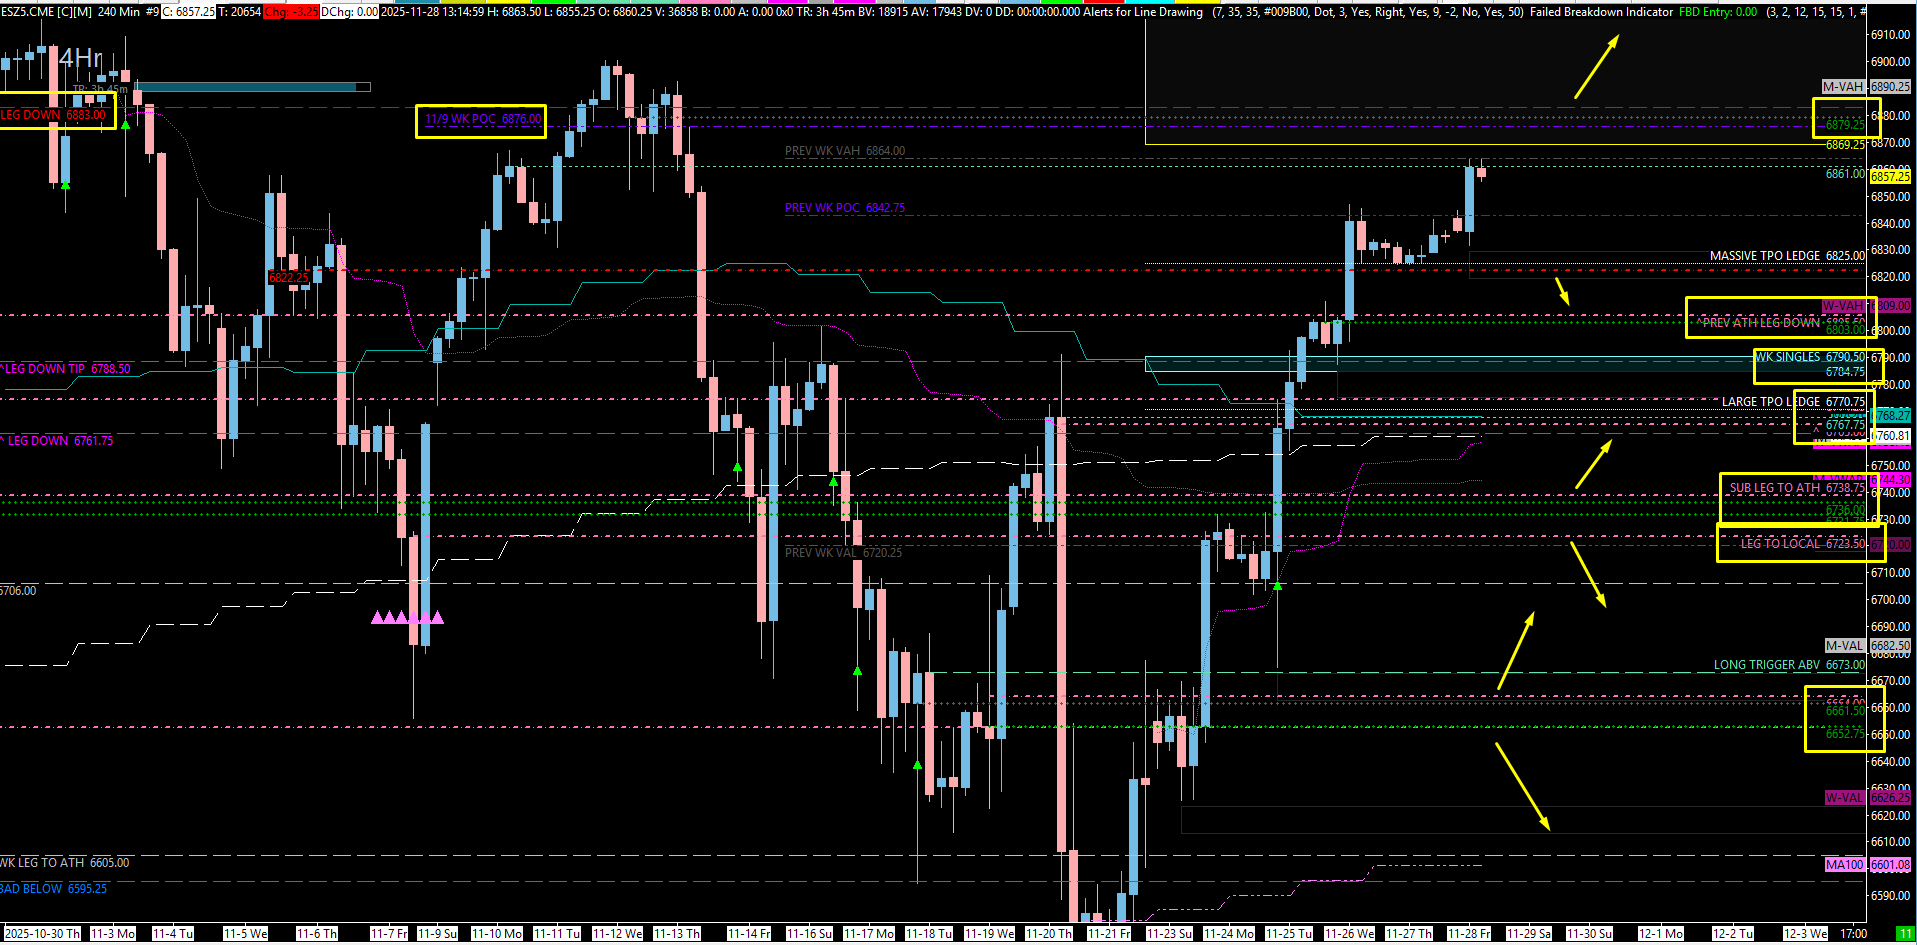
🎯 Detailed Actionable Trade Plan (ES Futures)
We have a bullish imbalance on the Weekly TPO taking us up to 6936.00. However, we have massive structure resistance immediately overhead.
🔴 Key Resistance Zones & Setups
Structure Resistance: 6883.00 - 6876.00
6883.00: Weekly level. Even if arguably tested, it looks like a serious place for a reaction.
6879: Untested 4hr and Gap Fill
6876.00: Previous Weekly Point of Control.
Actionable Setup: This is a “big f***ing spot.” It wouldn’t surprise me at all to see this area get a smack. Be careful up here.
TPO Imbalance Target: 6921.00
Low Volume Node (LVN) within the bullish imbalance range.
🔵 Key Support Zones & Setups
The TPO Ledge: 6825.00 - 6822.00
We have a massive TPO ledge at 6825.00 (Daily at 6822.00) where we rode the holiday volume.
Actionable Setup: If they push below this, we could come down to fill the weekly singles at 6784.00.
The “Smack” Middle: 6805.00
Untested Daily at 6805.00 and an “ugly” 4-Hour at 6803.00.
“The Jam” / Weekly Support: 6788.00
This is the Weekly Leg Tip (6788.00) and where the singles get filled.
Actionable Setup: I really like this spot. We also have a TPO ledge of stacked blocks at 6770.00.
“Buy It All” Zone (Alpha Long): 6765.00 - 6761.00
This zone includes the Daily Leg Down we gained (6765.00) and the Weekly Leg Down (6761.00).
Actionable Setup: “I would be willing to buy all into 6765.00.” This keeps us on the upside of the structure.
Confluence: Monthly/Weekly VWAP and 50-Day Moving Average are crawling up here.
The Line in the Sand: 6765.00
Actionable Setup: I would be cautious below 6765.00. Below there, we start to lose levels again (Daily 6738.00, 6736.00), and it becomes a “pain in the ass” to get back up.
📌 Cheat Sheet – Key Levels Recap
🧠 Final Thoughts
We are so bullish right now that you just never know, but at some point, we have to pull back a little bit. If we do, I want to use 6822.00 as an above/below spot, play the 6788.00 singles pop, and ultimately buy everything into 6765.00.
If VIX stays down, we go higher. Enjoy the rest of your holiday weekend.
Until next time—trade smart, stay prepared, and together we will conquer these markets!
Ryan Bailey, VICI Trading Solutions.
ES 4hr Only:
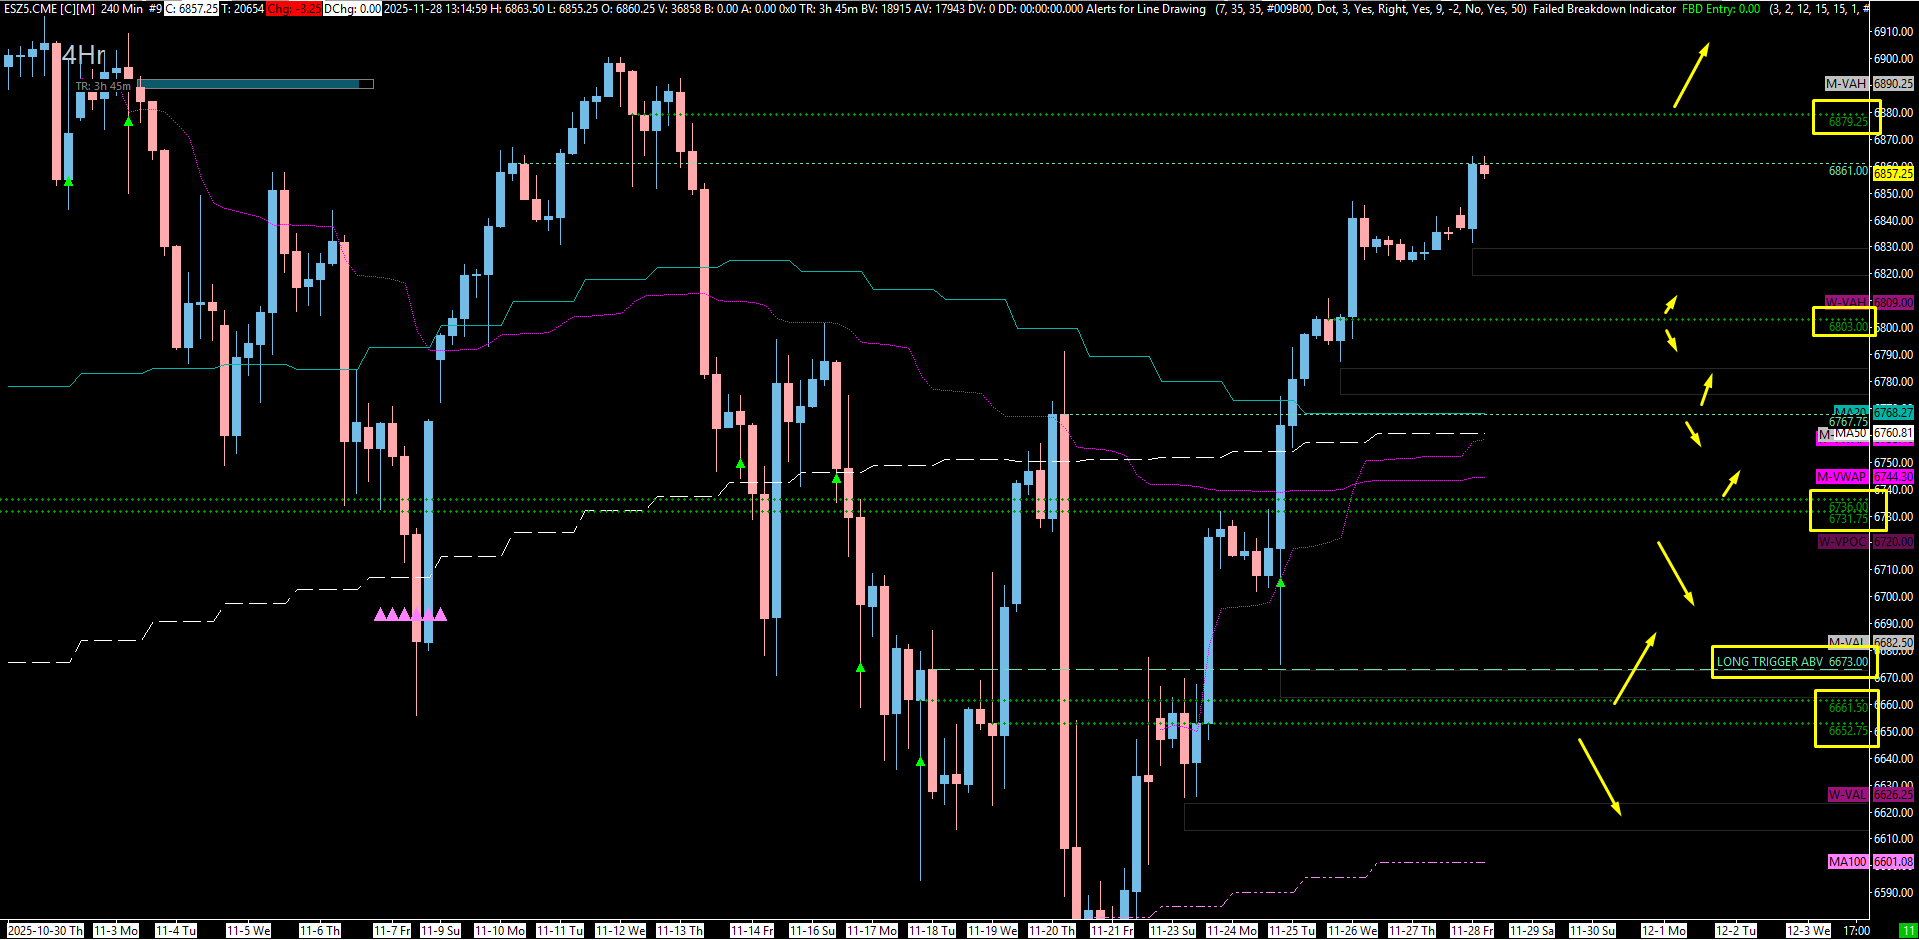
ES 4hr Overlay: