Good morning everybody. Happy Sunday.
It is time for the Weekend Review. After last week, we should all be sitting like a “fat cat” enjoying the afternoon. We have FOMC coming up this week, and we are so close to All-Time Highs we can almost taste it.
I am going to do things a little differently today because I want to look at SPX and VIX first. There are some discrepancies here. SPX has gained on the Weekly timeframe, while ES technically has not (though it hasn’t lost). The conviction is a lot higher on SPX, so we will use it as our lead.
I also made a new indicator regarding our 80% rule exclusive for Substack subscribers—check the post later this afternoon.
🧠 Current Market Context
We have been marching up. Last week, SPX sealed a nice gain above the weekly leg at 6845.00 (Step 1). Then on Friday, we cemented another firm close above the daily leg at 6867.77 (Step 2). This leads me to a much more bullish stance, assuming we make new All-Time Highs.
However, we need to be careful. VIX is extremely low, and with relative volume low, any news (like the Microsoft AI dip last week) can spark volatility. My bias is long (”I’m in long mode”), but I am looking for specific buy spots on a pullback.
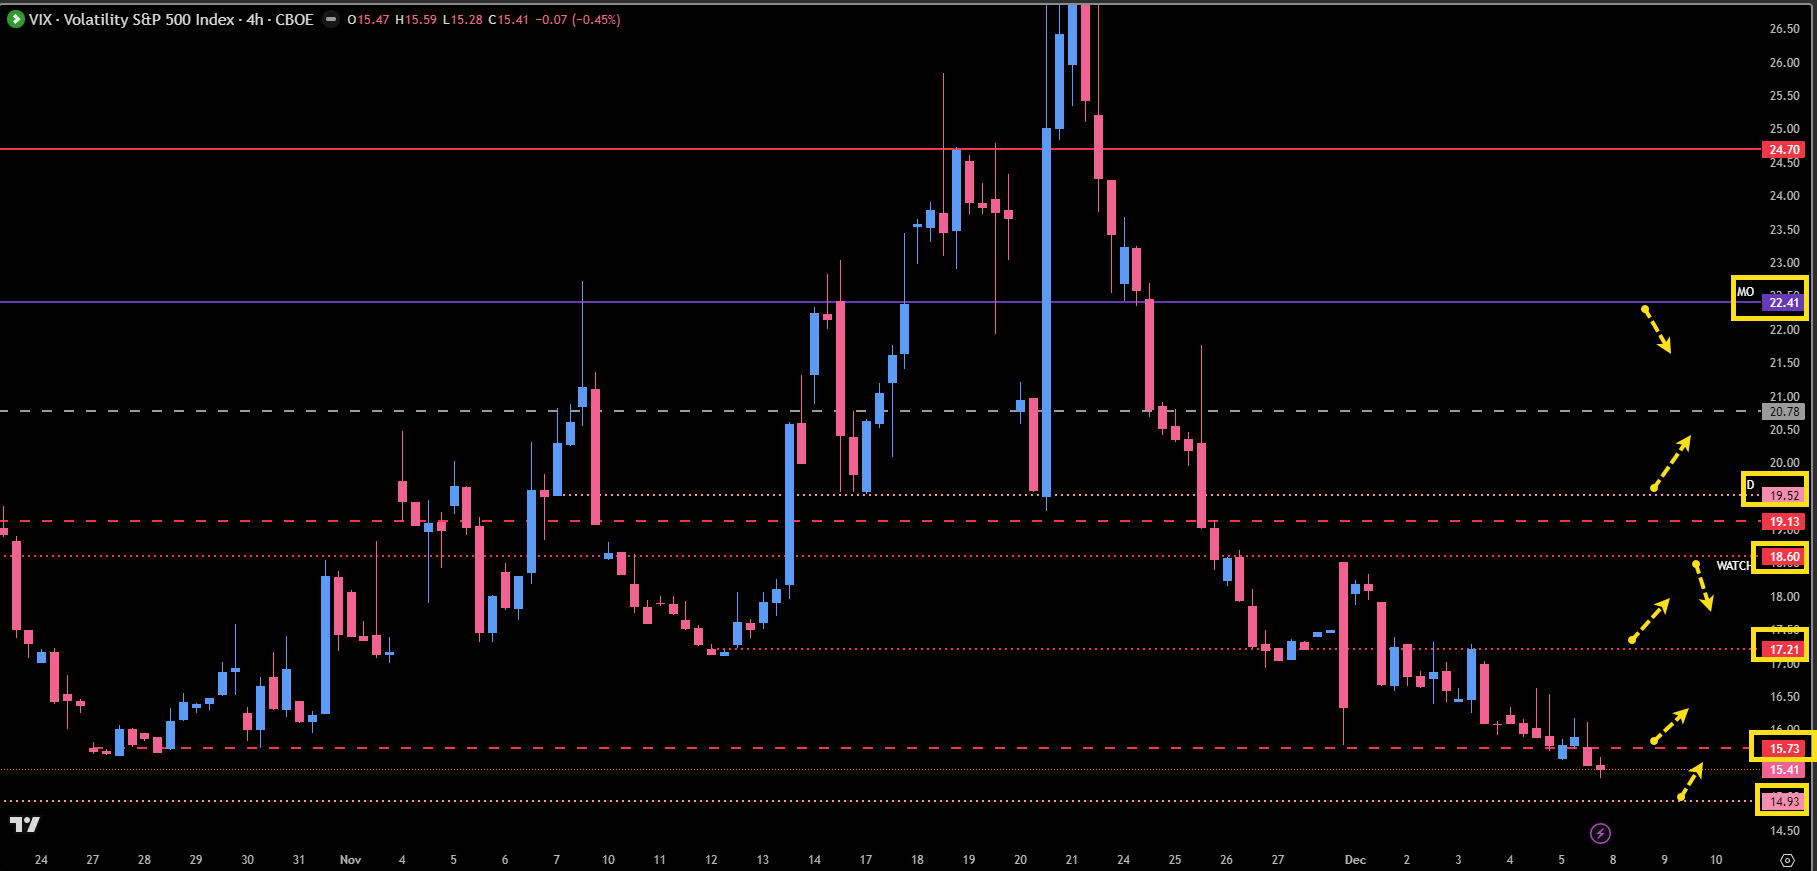
🚨 VIX Analysis: The “Fragile” 15 Handle
VIX is getting its head beat in, but be aware: every time we get down here into the 15.00 handle, we tend to get a pop. When VIX pops from here, indices get smoked fast (100-200 points).
The Pivot: 15.73 (Weekly Leg High). This is the area to watch. Right now we are below it.
Support: 14.93 (Untested Daily). If this holds, it could pop us back up.
Resistance:
15.92 (Untested Daily): If this plays, we need to see it immediately get back below 18.60 for continuation down.
17.21 (Tested Daily) & 18.60 (Major Pivot).
22.41 (Untested Monthly): The ceiling for now.
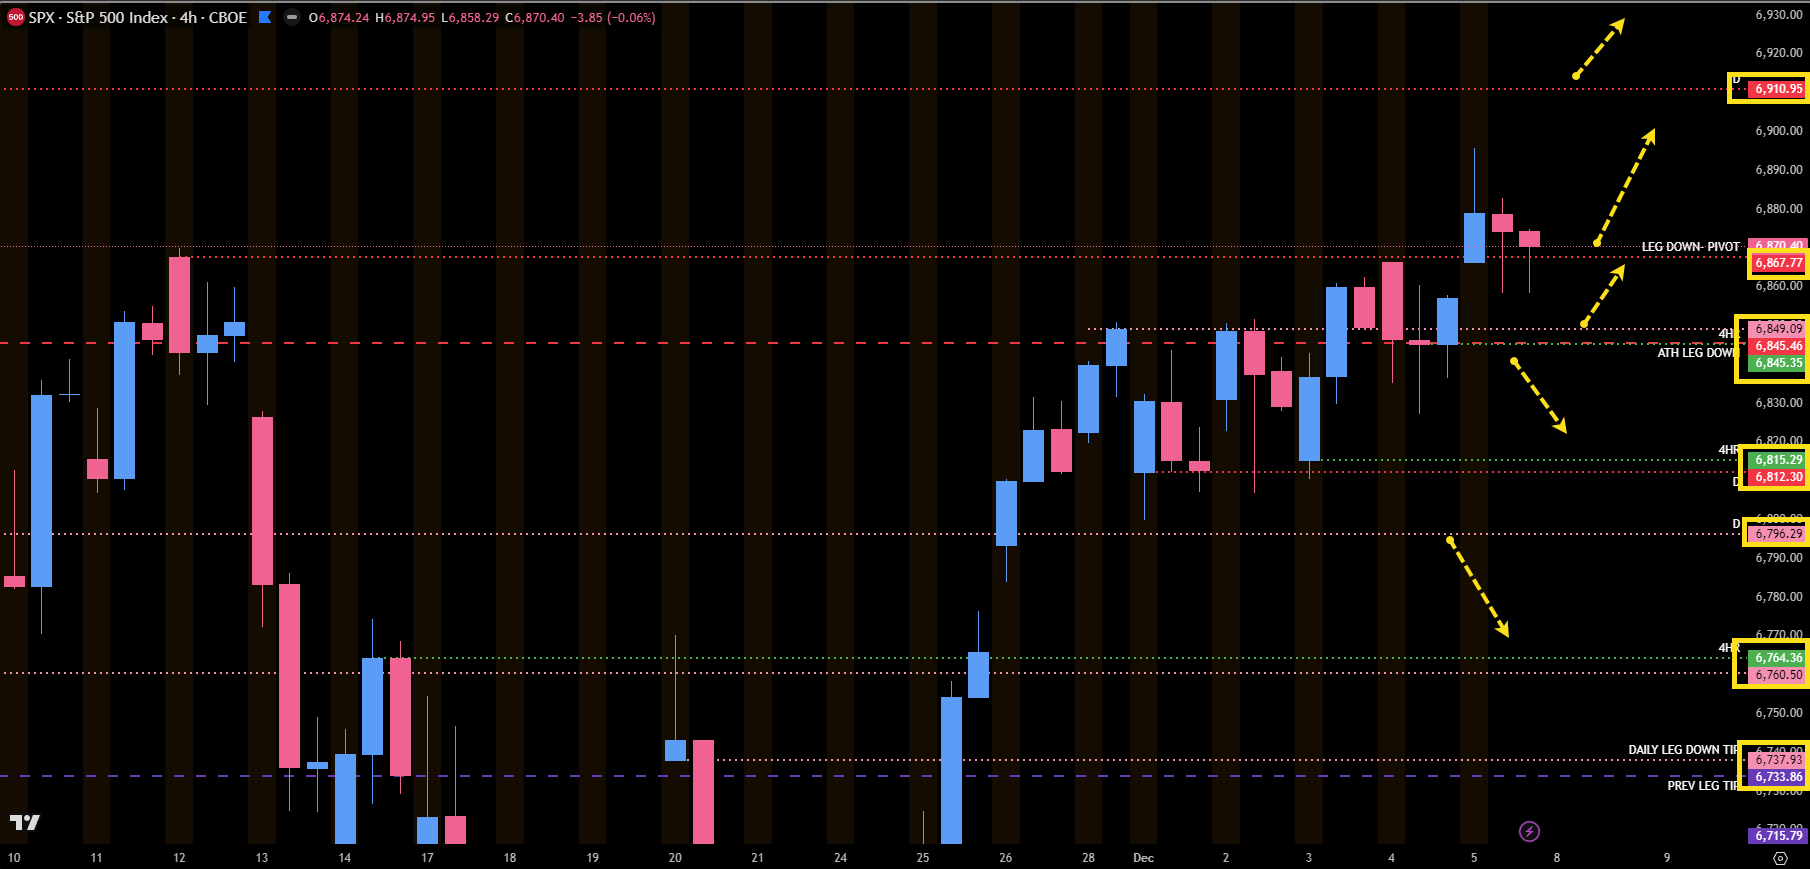
📈 SPX Analysis: The Leader
SPX is leading the charge with a weekly close above 6845.00 and a daily close above 6867.77.
The Pivot: 6867.77 (Daily Leg Down). This is our pivot for “above or below.”
Upside: Above here, we look for 6910.95 (Highest Tested Daily). There is nothing untested above us; we are free to make new All-Time Highs.
Primary Buy Zone: 6849.00 - 6845.00. This area is littered with support (Daily/Weekly). I will be looking to buy this area on first touch.
Secondary Support: 6815.00 (4-Hour) & 6812.00 (Daily). If we move below 6845.00, look for 6815.00 to hold.
Lower Levels: 6796.29 (Untested Daily) and the “Massive” 6760.00 area (Daily/4-Hour).
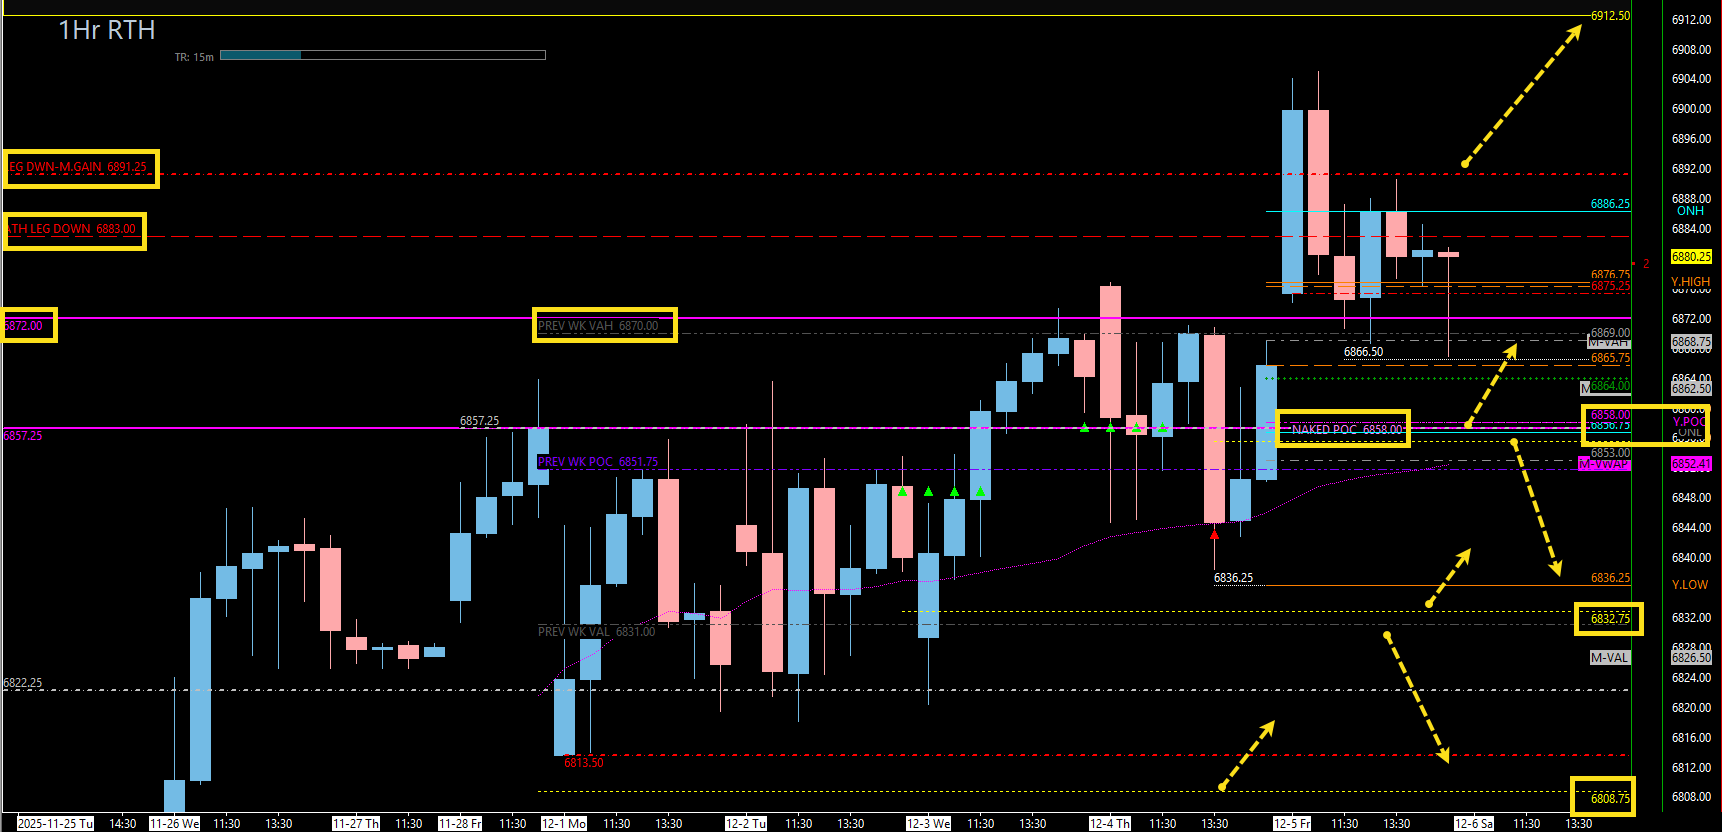
🎯 Detailed Actionable Trade Plan (ES Futures)
ES has a bullish imbalance on the Weekly TPO taking us up to 6936.00. However, unlike SPX, ES has not gained the Weekly leg down at 6883.00.
🔴 Key Resistance Zones & Setups
TPO Target / Profit Take: 6921.00
Low Volume Node (LVN) in the weekly profile. This will be a profit-taking area for me.
The High Target: 6936.00
Top of the Weekly Bullish Imbalance.
Weekly Hurdle: 6883.00 - 6891.25
Weekly Leg Down (6883.00) and Daily Leg Down (6891.25). We need to get back above these to clear the path to ATHs.
🔵 Key Support Zones & Setups
Immediate 4-Hour: 6864.00
The only untested area on the 4-Hour timeframe.
Actionable Setup: If we sweep lows, look for a pullback into 6864.00 to reclaim and go.
“The Speculation” Buy: 6855.50 - 6858.00
Includes 1-Hour (6855.50), Naked POC (6858.00), and Composite POC (6859.00).
Actionable Setup: I think we could come down, sweep into 6855.50, get back above 6857.25 (Monthly), and go. If that happens, “buy, buy, buy.”
Weekly Value Low Play: 6832.75
Previous Weekly Value Area Low range.
Actionable Setup: If we move below 6855.00, we could sweep Thursday’s low and play 6832.75. We want to see it get right back above the wick at 6836.25. Take profits around 6855.00.
Last Line Support: 6808.75
Untested 1-Hour.
The Monster: 6805.50
Significant Daily.
Actionable Setup: This is where “s*** gets real.” If we get below, we are in trouble. If we test here (or 6808.75), we want to see an immediate reclaim of 6813.50 and 6822.00.
Deep Value / TPO Ledge: 6770.00
Large Weekly TPO Ledge (Stacked Blocks).
Actionable Setup: If we break 6805.00, I actually like this area (around 6765.00 - 6770.00) more than the 6788.00 singles fill.
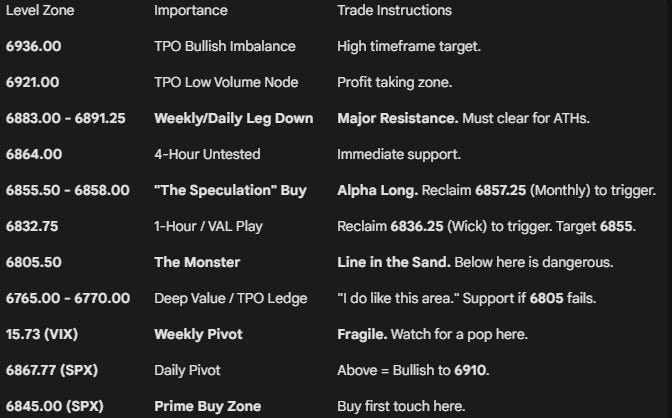
📌 Cheat Sheet – Key Levels Recap
🧠 Final Thoughts
We have gained on the Weekly on SPX and the Daily on ES. We haven’t lost on the Weekly on either. This looks like we are going to continue to try to make All-Time Highs.
However, VIX is in the 15s and fragile. Be careful on the long side at 6838.00 and 6867.00 if we don’t hold structure. I am looking to buy the 6855.50 area or the 6832.75 sweep.
Until next time—trade smart, stay prepared, and together we will conquer these markets!
Ryan Bailey, VICI Trading Solutions.
ES 1HR RTH CHART: