S&P Edge (ES) Daily Trade Plan: The 4-Hour Loss vs. Daily Hold
A detailed ES & VIX plan for Jan 16th, breaking down the 7004 inflection point, the 6971 buy zone, and the critical “developing” support at 6964.50.
Scheduled News
No Red Tag News
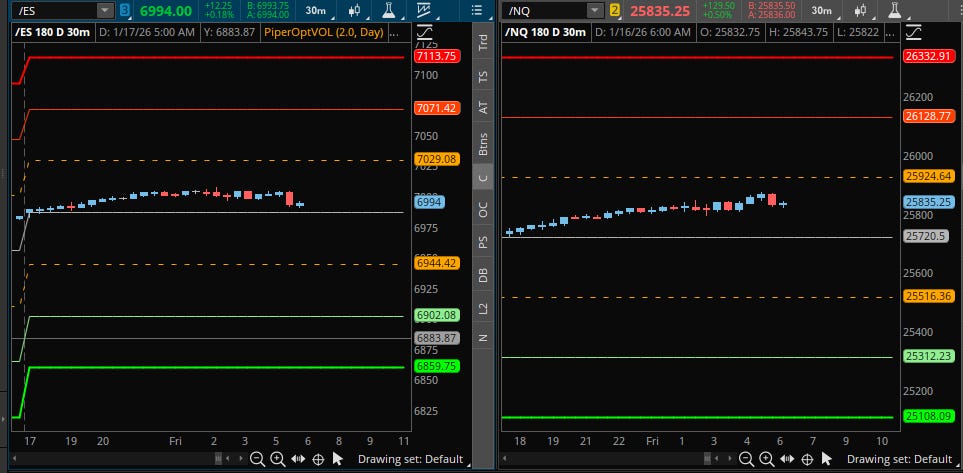
Options Volatility Levels
Good morning everyone. Today is January 16th, it is Friday.
We come into the day off of an insane trade plan yesterday where we had the High Short to the tick. This short ended up paying over 45 points if you were patient, retracing 75% of the gap fill. Yesterday was a glorious day for our trade plan members as we were able to take one excellent trade and score big profits for the rest of the day.
As we come into the day this morning, we have No Red Tag News to speak of. We are directly in the middle of the range from yesterday, which puts us in a very precarious position on direction determination.
A Note on Today’s Market:
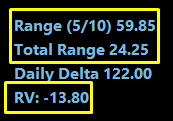
Volume: Relative Volume is low at -20%.
Range: We have an approximate range of 60 points. We have moved 25 points in the overnight session, leaving approximately 35 points above or below the overnight highs and lows.
Structure: We have lost on the 4-Hour timeframe, but we have not lost on the Daily or Weekly timeframe. This leads us to believe we could still push higher, but the 4-Hour loss suggests volatility and money to be made in both directions.
Gap Fill: Yesterday we did not quite fill the gap down to 6968.00, so be conscious that this is still a spot that could potentially get filled.
🧠 Current Market Context
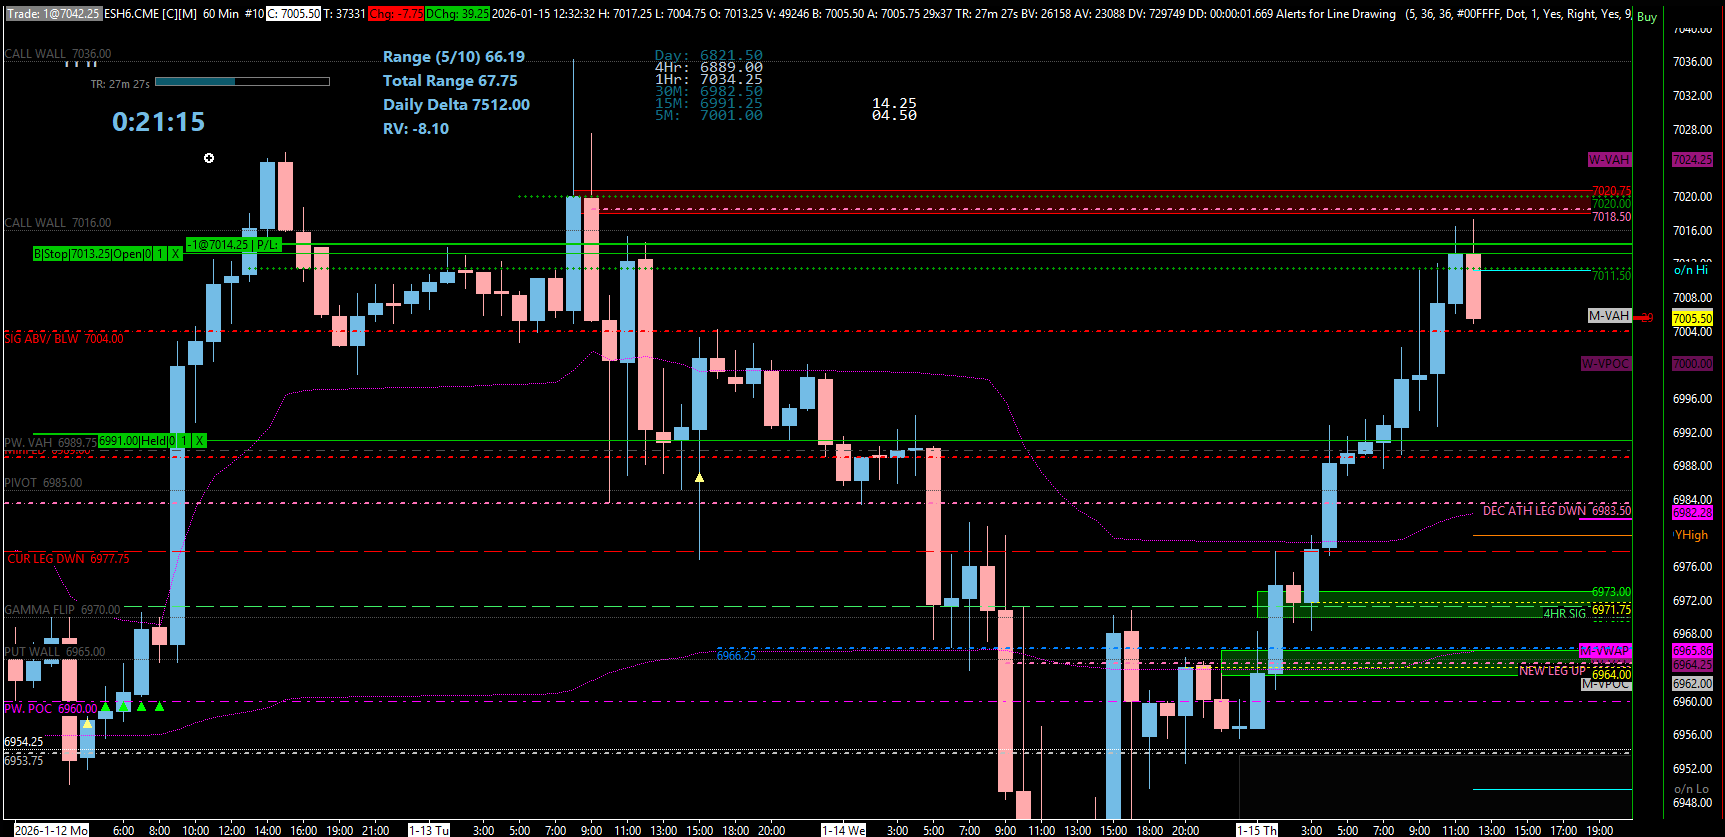
Yesterday at the close, we gained traction off our 6977.75 Weekly and played the 6983.50 Daily for the pop higher. This took us into our 7004.00 Daily/4-Hour level, only to reject once again.
Currently, we are in Positive Gamma territory; however, our negative gamma flip level is located directly at an area of contention where things go south for the ES.
🚨 VIX Analysis: The 15.73 Pivot
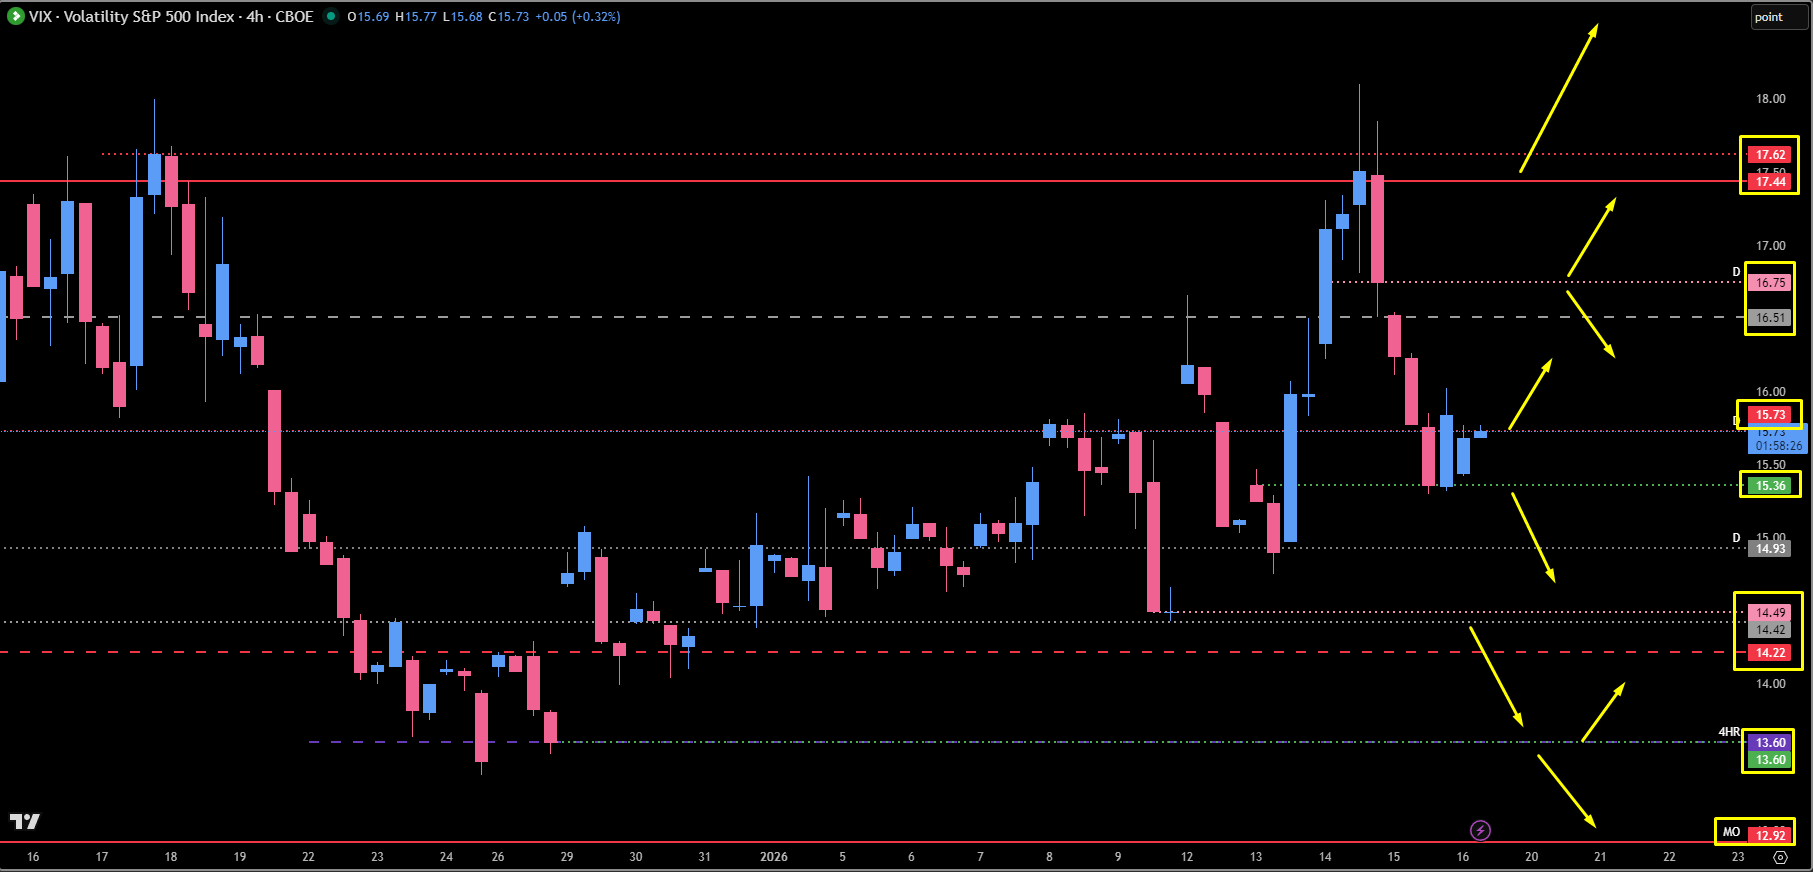
VIX held the lows yesterday at our 15.63 4-Hour and is currently sitting above our Daily Pivot at 15.73.
The Pivot: 15.73 (Daily).
Headwind: A push above 15.73 could send us to the Untested Daily at 16.75. This is a major inflection pivot; a push above 16.75 would be a significant win for the indices (shorting opportunity/headwind) potentially leading to the 17.44/17.62 Monthly/Daily resistance.
Tailwind: If price pushes below 15.36, the indices immediately see relief. Price could continue down into our 14.49 Untested Daily.
Deep Target: We look for a break below the 14.22 Weekly for much more continuation to the upside (ATHs).
🎯 Detailed Actionable Trade Plan (ES Futures)
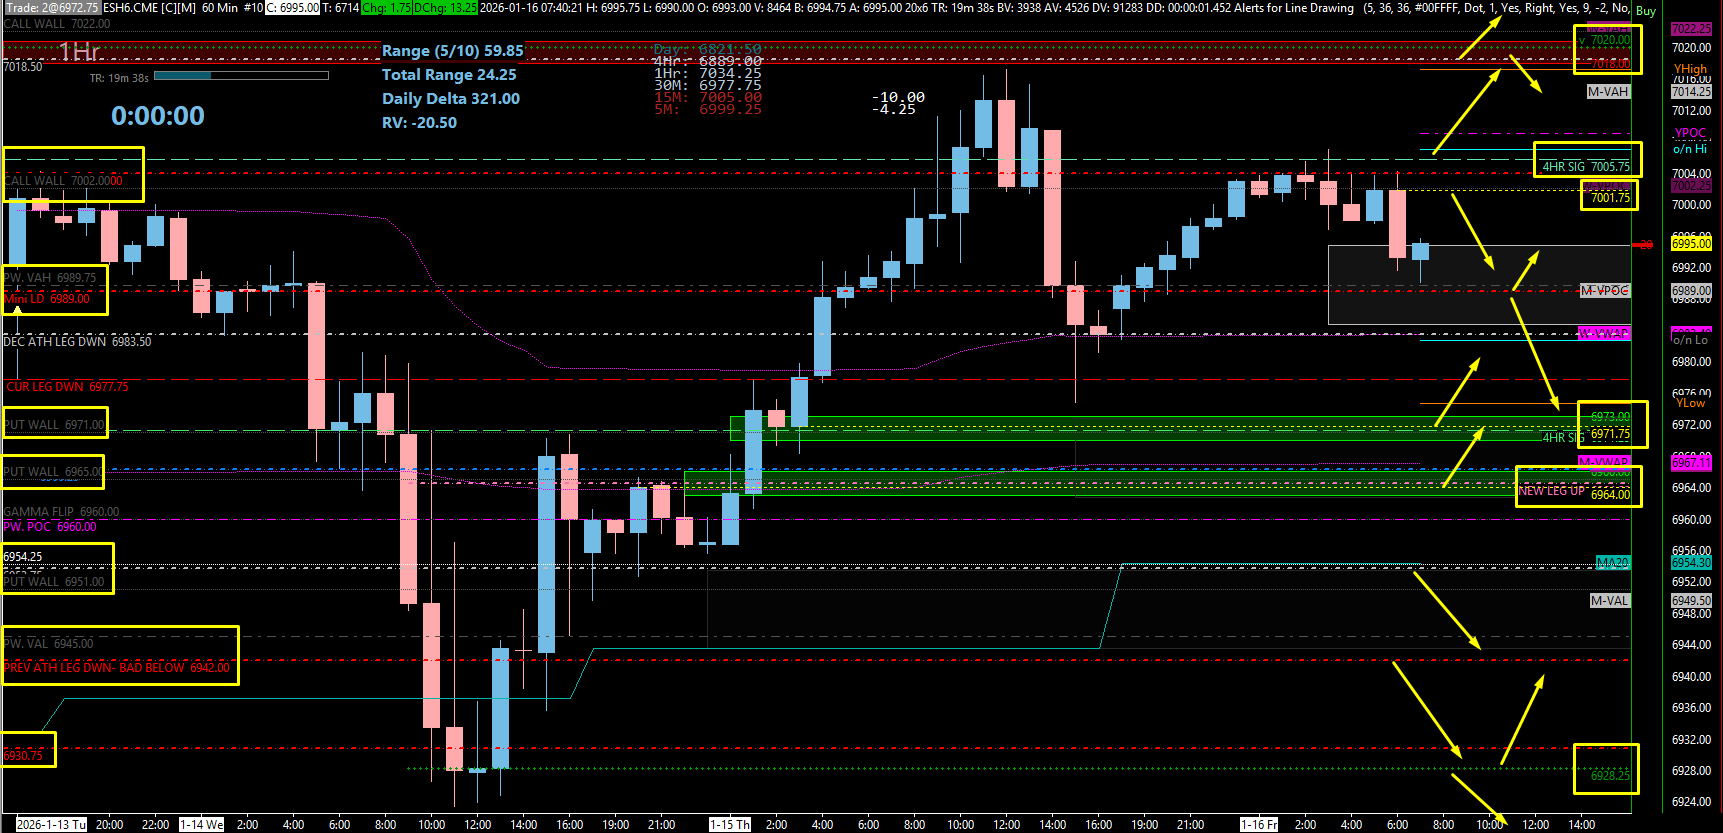
We are monitoring the 7004.00 inflection point for resistance and the 6971.00 area for our first buyable spot.
🔴 Key Resistance Zones & Setups
Immediate Resistance: 7001.75
Minor 1-Hour level. This is all I have untested until the significant daily.
Major Inflection Point: 7004.00
Significant Daily.
Actionable Setup: This determines more up or down. The overnight rejection indicates its importance. If they get back above this spot, they could push higher into 7018.50.
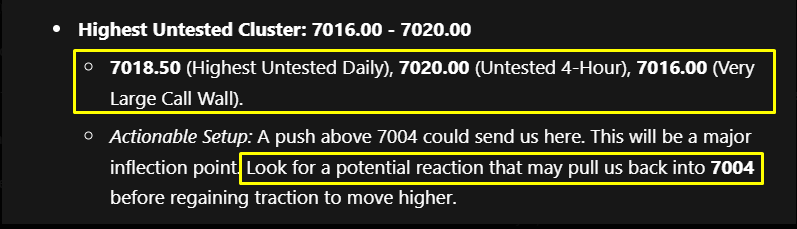
Highest Untested Target: 7020.00
7020.00 (Untested 4-Hour), 7022.00 (Large Call Wall).
Actionable Setup: This is very much untested. I would look for 7020 to play and get back below Yesterday’s High to potentially pull us back into 7004.
Note: Due to the near miss yesterday, be careful as this could be potentially wiped. Look for acceptance below Yesterday’s High. Acceptance above 7020 targets new All-Time Highs.
🔵 Key Support Zones & Setups
Momentum Pivots: 6983.50 - 6989.00
6989.00 (Major Daily Pivot / Prev Weekly VAH). Judge momentum here.
6983.50 (Tested Daily / Prev Leg Down). Intermediate area / Overnight Low.
6977.75 (Weekly). Good barometer for Above/Below.
First Buyable Spot: 6971.00 - 6971.75
6971.00 (Untested 4-Hour / Put Wall), 6971.75 (1-Hour).
Actionable Setup: I like this area; it got a lot of touches from underneath. Look to buy on First Touch. Want to see it get back above Yesterday’s Low at 6975.00 and ultimately the Weekly at 6977.75 for continuation.
Daily Leg Up (”Developing”): 6964.50 - 6960.00
6964.50 (Daily Leg Up), 6966.25 (ETH Daily), 6965 (Put Wall), 6967 (Monthly VWAP), 6960 (Gamma Flip), 6960 (Prev. Weekly POC).
Actionable Setup: This is my Last and Final Buy Spot to keep hold of progression higher.
Warning: This daily has not truly gained (it is developing). Probabilities of a large reaction are reduced. We want to see 6964.50 play and immediately get back above 6971.75 (specifically reclaim 6973) to confirm buyers have stepped in.
Line in the Sand: 6953.75
Context: This is where everything goes sour for the Bulls. Underneath here, we lose major support.
Deep Support / Liquidity Pop: 6928.25 - 6930.75
6942.00 (Significant Daily/Prev Weekly VAL) - Target/Profit take.
6928.25 (4-Hour Leg End).
Actionable Setup: Because the 4-Hour has not gained, this is susceptible to only a “Liquidity Pop.” Want to see 6928.25 play and get back over 6930.75. Look for resistance at 6942.
Ultimate Leg End: 6880.25 (Amazing buying opportunity).
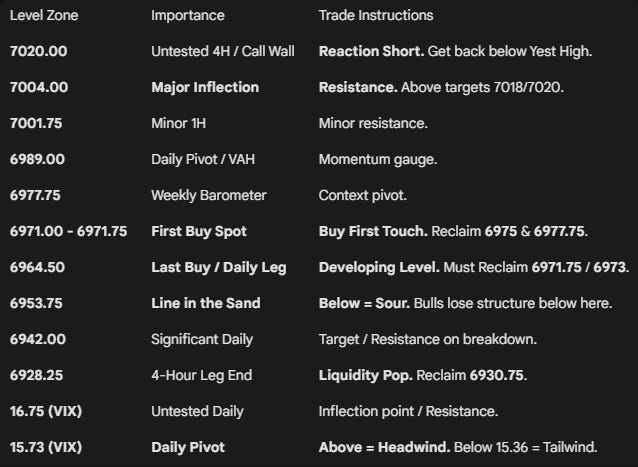
📌 Cheat Sheet – Key Levels Recap
🧠 Final Thoughts
We come into Friday directly in balance of yesterday’s range. We need to be extremely careful on levels that we play. Our job is to let the price come to us; our edge is in the edges.
Wait until price moves outside of this range to catch a trade. Let’s finish this week strong—it’s not our day to guess.
Until next time—trade smart, stay prepared, and together we will conquer these markets!
Ryan Bailey, VICI Trading Solutions.
Options GEX Levels
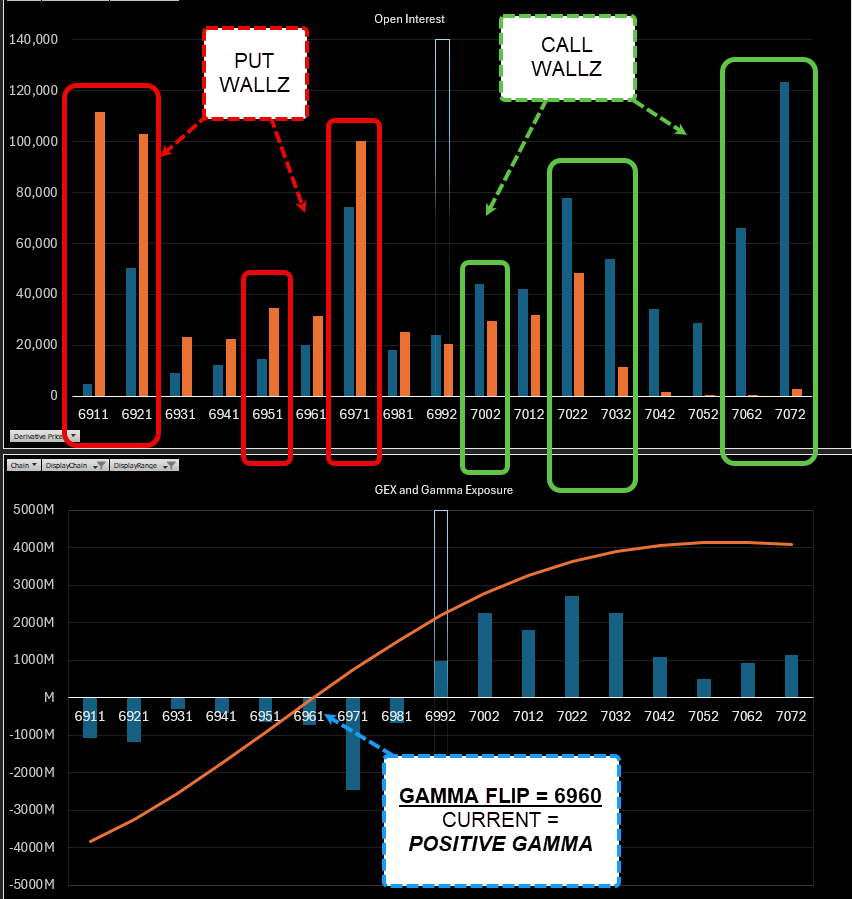
SPX
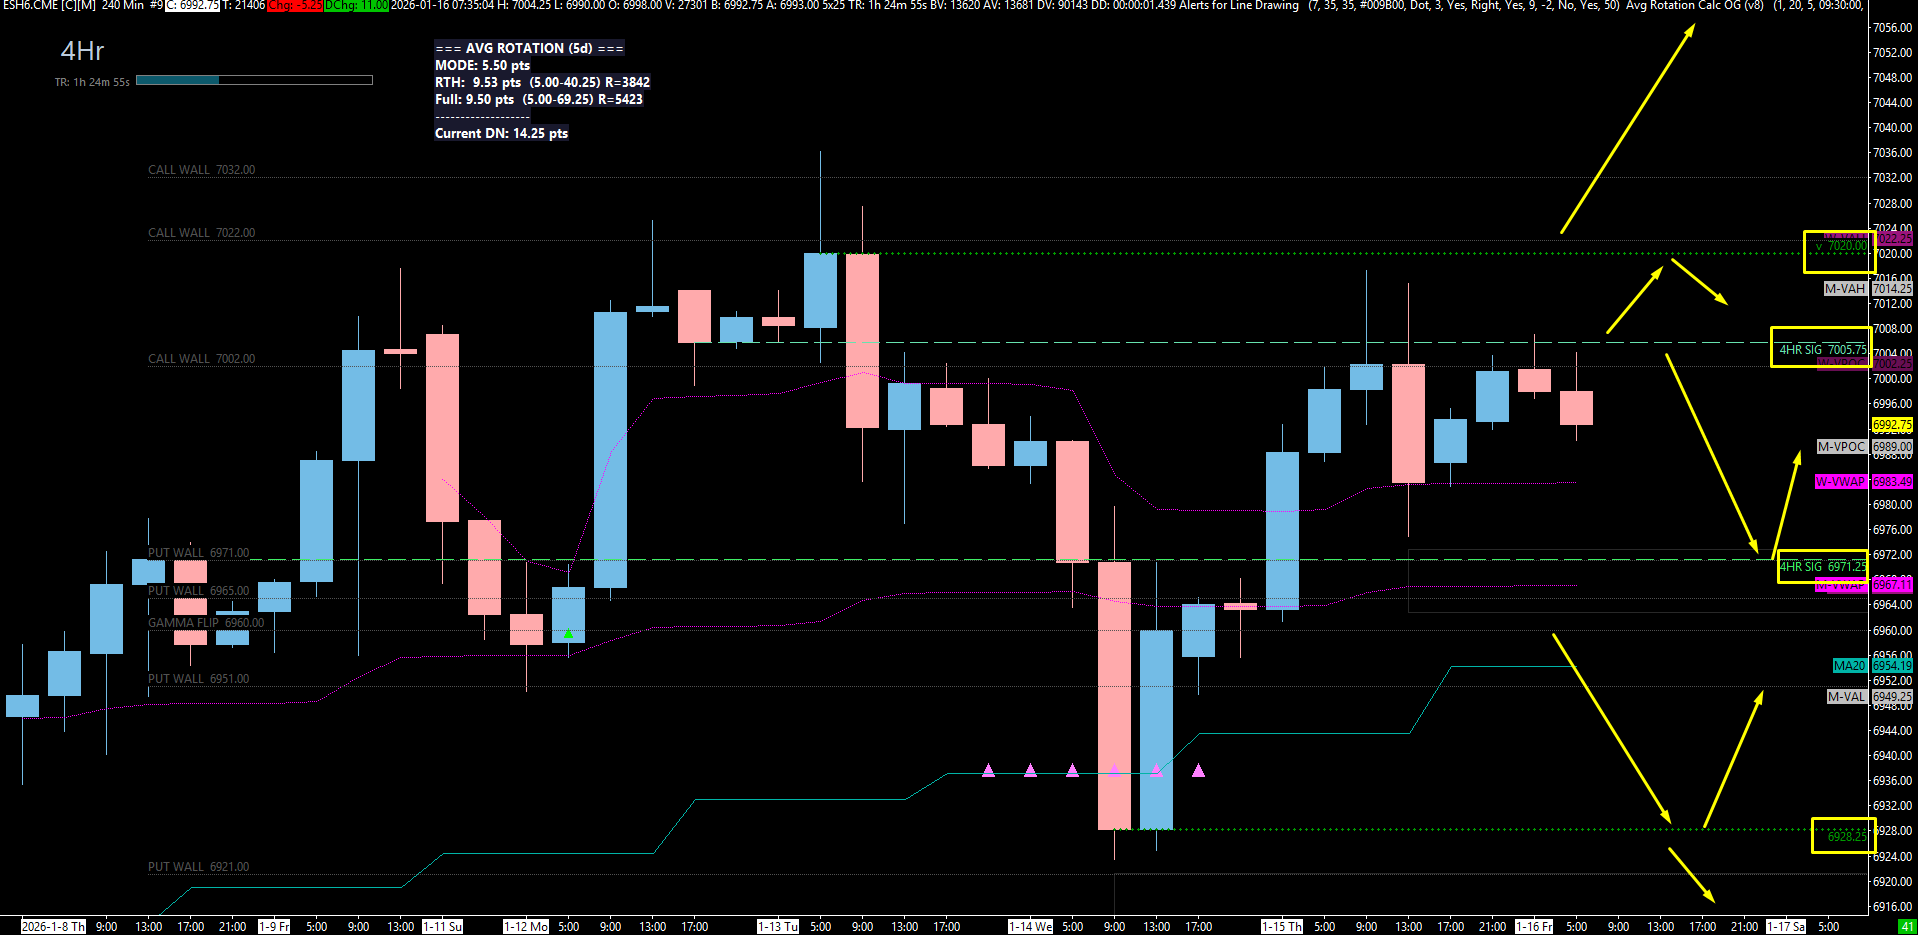
4hr Chart ES
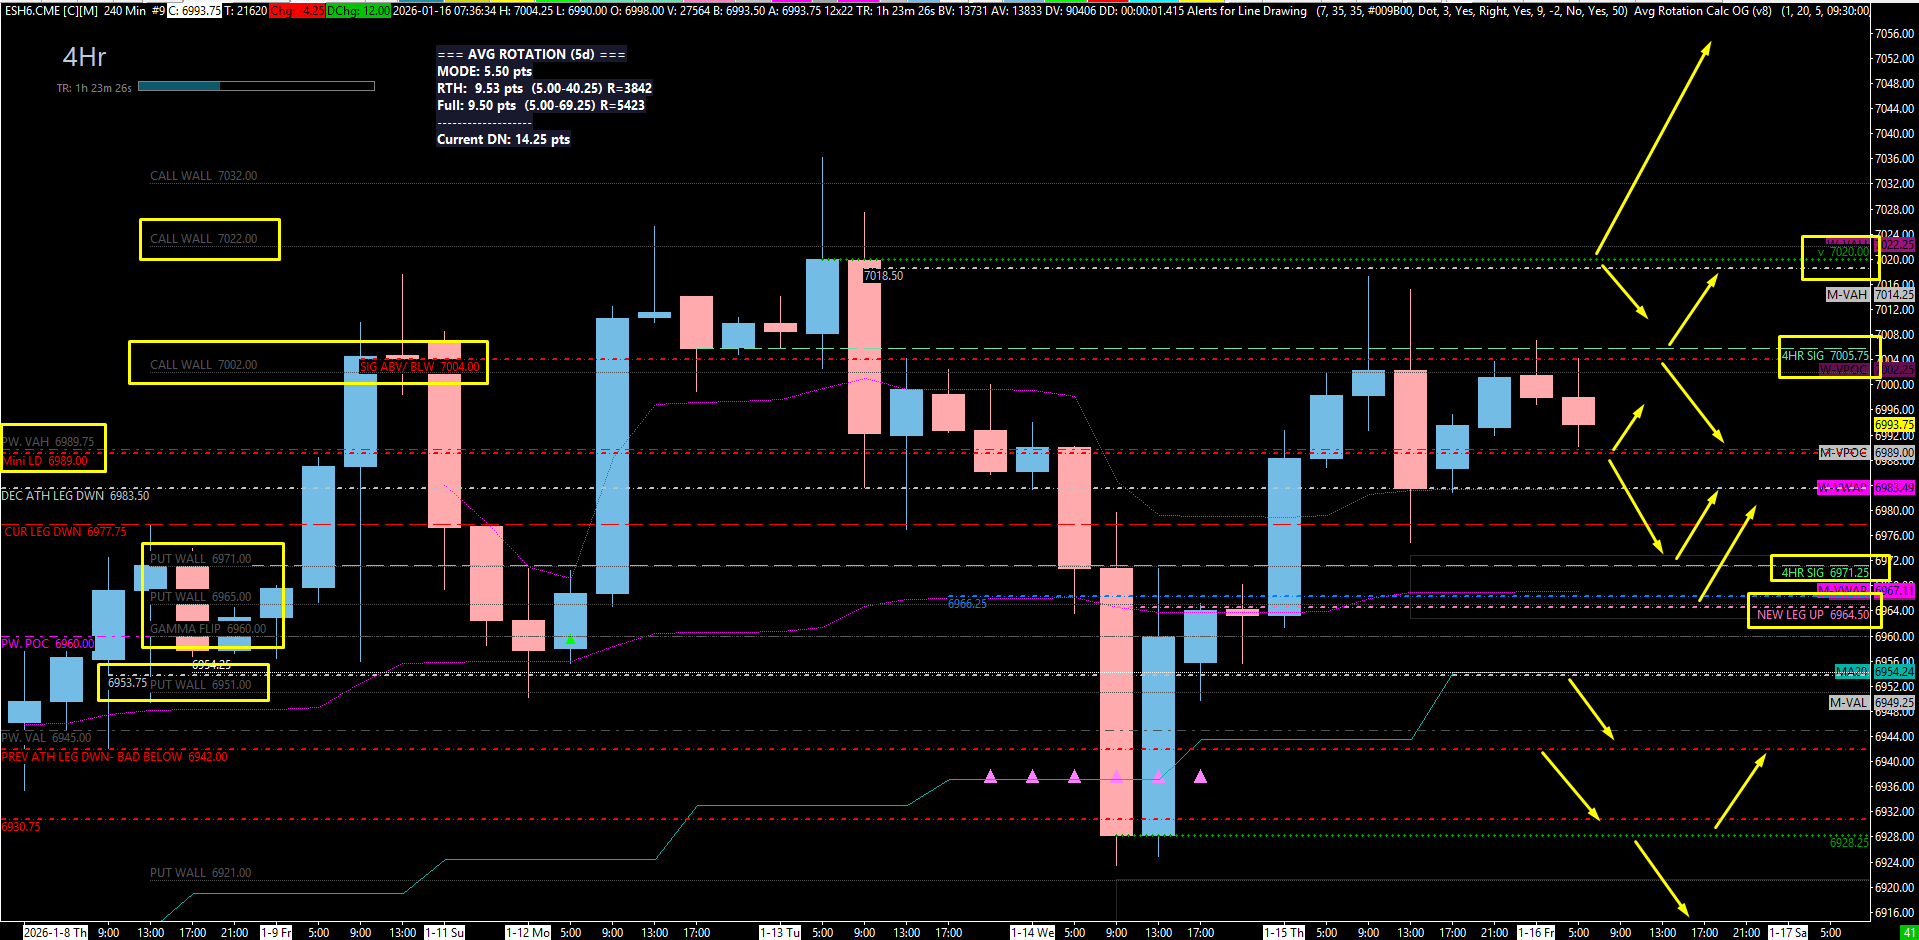
4HR CHART ES - FULL OVERLAY
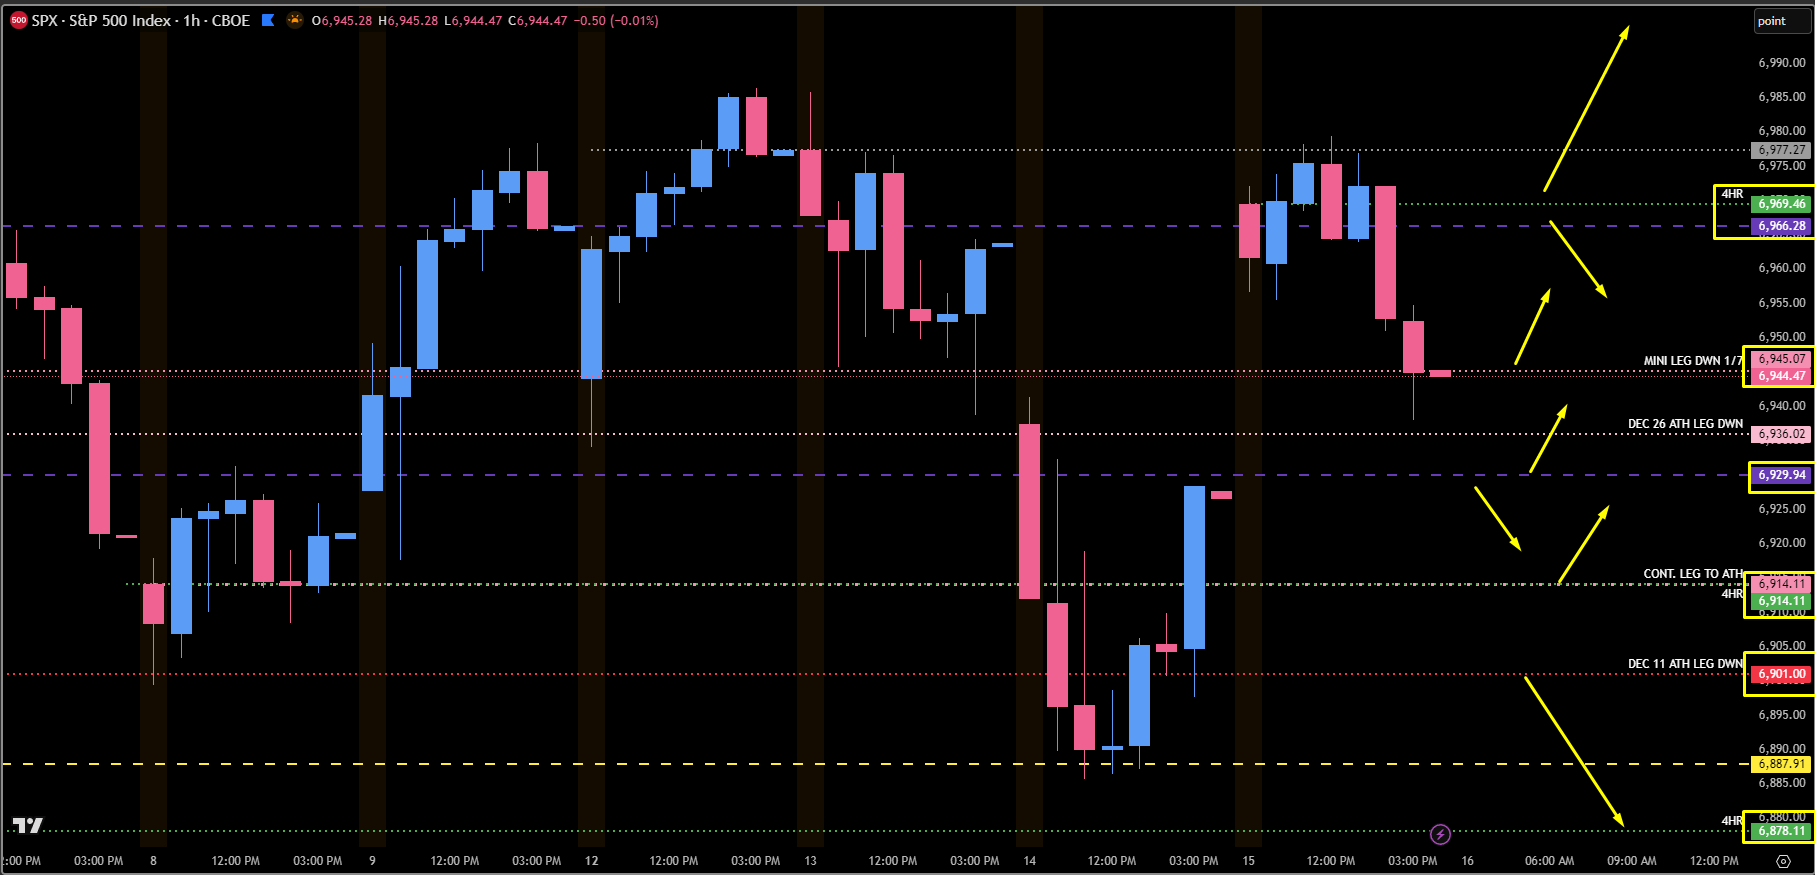
1Hr Chart ES