You know what time it is—time for the weekend review.
Before we dive in, I wanted to let you all know that I've officially fired up the Substack newsletter again. If you want to get my daily morning outlooks delivered to your inbox from Tuesday to Friday, along with occasional drops on crypto and stocks I'm watching, now is the time to sign up. You can find the link HERE, and I'm offering a free seven-day trial for everyone who checks it out. I hope to see you there.
Now, let's get to the charts. Last week was a fantastic example of why we trust our levels and our process. The squeeze was on, and it was a great week for those who were in on the trade. The bulls have retaken the driver's seat, and it looks like all-time highs are back on the menu.
🧠 Current Market Context:
The most important development this week is that we officially gained on the weekly timeframe. It was only by a single tick, but a gain is a gain, and it came after a strong push into the close on Friday. From a broader perspective, we are trading inside the previous week's value area and methodically working our way up to the value area high around 6440.00.
The reason for my renewed bullish conviction is simple: on Friday, we talked about how if the 6407.00 resistance didn't drop the market, we would likely see new highs. This played out perfectly. The market had already tested the weekly level at 6425.00, sold off hard to the 4-hour leg around 6330.00, held that leg, and then drove all the way back up to secure the weekly gain. That sequence is classic bullish behavior.
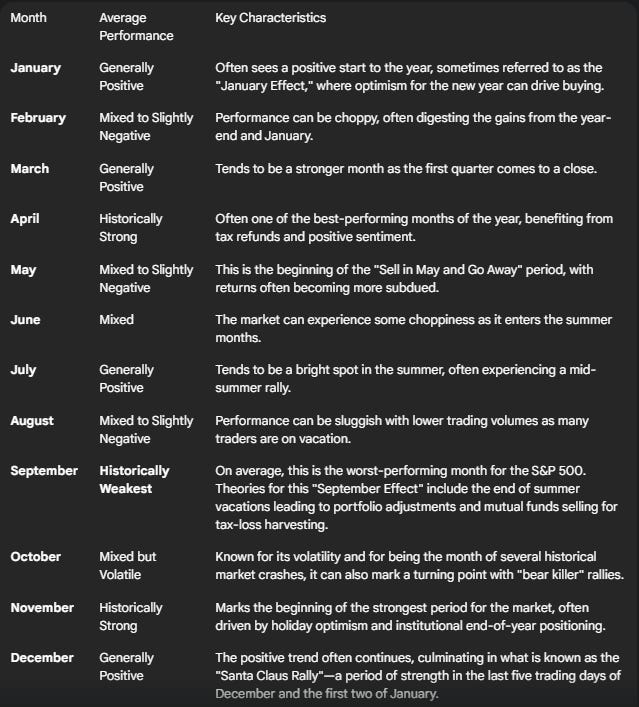
However, a word of caution on seasonality. September is historically the weakest month of the year, often called the "September effect," and August can be sluggish. While the chart looks strong now, we have to be prepared for a potential pullback next month, which is why our deeper support levels remain incredibly important.
🎯 Detailed Actionable Trade Plan:
🔴 Key Resistance Zones (The Path to New Highs)
There isn't a lot of resistance left, which tells me the bulls need to hit the gas if they want to continue this move.
Immediate Resistance: 6431.75 (Daily Level)
This is the next big spot above us.
Actionable Setup: If we hit this level, I need to see an immediate failure and acceptance back below 6425.00 for any short to be valid. If not, the market will simply continue to march higher.
The Final Boss: 6453.75 (4-Hour Level)
This is the only 4-hour resistance I have marked higher. If this level doesn't produce a significant reaction, we are making a new all-time high.
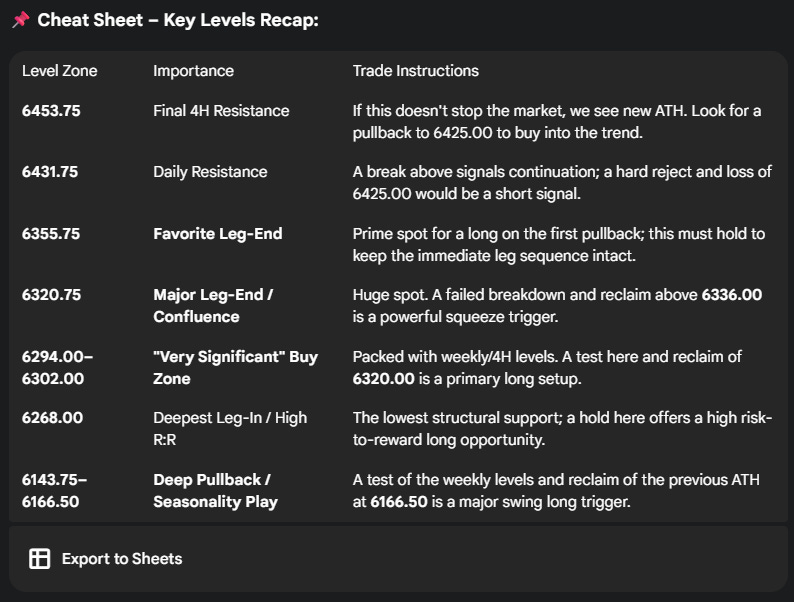
Actionable Setup (Continuation Long): A likely scenario is a push up to play 6453.75, a healthy pullback to the 6425.00 area (old resistance becoming new support), and then another leg up to take us to new highs. A successful retest of 6425.00 would be a prime spot to buy into the long trend.
🔵 Key Support Zones (Where to Buy the Pullback)
It’s all about the legs, baby. We want to see these key structural levels hold on any pullback.
Initial Pullback Zone: 6371.00 – 6384.50
I like the 4-hour level at 6384.50 for support; it aligns with the prior day's open and has good structure also there is a large cluster of trapped sellers there waiting to be let out. Below that, I'm watching the 6371.00 area, which is a reset 4H/1H level that looks technically untested on the one-hour chart.
My Favorite Leg-Ends: 6355.75 & 6320.75
The 4-hour leg-end at 6355.75 is probably my favorite spot on an initial pullback. For this leg sequence to remain valid, we want to see this area hold.
The next major leg-end is 6320.75. This area is a huge confluence zone, lining up with the key dailies at 6320.00/6323.00 and the previous weekly value area low at 6324.00. A failed breakdown here, with acceptance back above the 6336.00 4-hour level, could trigger a massive squeeze higher.
The "Very Significant" Buy Zone: 6294.00 – 6302.00
This is one of my most important zones on the entire chart to look for longs. It's packed with confluence: two untested weekly levels (6294.00 and 6302.00), a two-week composite POC (6303.00), 4-hour levels below at 6292.00/6289.00, and market inefficiencies (singles) just above it. A test of this area followed by a reclaim of 6320.00 would be an extremely strong long signal.
The Deepest Leg-In: 6268.00
This is a daily/weekly combo and represents the lowest leg-in of the entire structure. While I'd prefer the weeklies above to hold, this level offers the highest risk-to-reward for a long, as a hold here could squeeze all the way back up.
🚨 Momentum Shift Levels:
6344.75 & 6320.00/6323.00: These daily levels have been our godsend for monitoring momentum shifts all week. As long as we are above them, bulls are in control.
Below 6248.00: If we were to lose all the support above and get below this daily level, things get "fugly" to the downside again.
🧠 Final Thoughts:
The bulls have made their move, and the path of least resistance appears to be higher. This week, the plan is to trust the leg structure. On any pullbacks, we have a clear road map of high-probability zones to look for long entries. As long as the key leg-ends hold, the expectation is for a continuation to new all-time highs. Stay focused, manage your risk, and let's trade the plan.
Be careful, trade safe, and I'll see you for the morning outlooks on Tuesday.
Until next time—trade smart, stay prepared, and together we will conquer these markets!
Ryan Bailey,
VICI Trading Solutions
Historic Seasonality Chart for the S&P 500