

Welcome back everyone, and happy Sunday. It is time for the Weekend Review, and it is an absolutely gorgeous day by me — I hope it is by you too. I actually spent most of the weekend outside working on my yard, and I hope you got a chance to do the same: walk away from the screens, recharge the batteries, touch some grass, spend time with the family or even just on yourself. It is so important to decompress, because the markets will always be here. We were blessed to have a holiday on Friday with Juneteenth, so I hope you took full advantage.
Now that the rollover is officially behind us, we finally get a clear picture of what the market is actually looking for us to do and the inefficiencies that still have to play. Last week was a wash in my opinion — I told everyone not to trade the rollover, and I meant it. But that is over now. We have real levels and real structure to play, and I am genuinely excited because we have gone from surfing all-time highs with barely a four-hour level to work with, to having a whole gang of daily levels with four-hour confluence. Those daily levels produce massive moves. As long as we are patient, we have some serious high-probability, buy-the-dip trades lining up in our favor. Let’s keep this one skinny and clean — SPX, then ES.
A Note on This Week’s Market:
News: Friday was the Juneteenth holiday — the market was closed, so that action is null and complete garbage. We forget about it entirely; it is just futures drift nonsense. More importantly, the M-to-September (U) contract rollover is now complete, which finally gives us a clean read on the real structure and the inefficiencies left to play.
Volume: The recent push higher was produced on a low-volume, thin-liquidity move, which left a massive inefficiency on the weekly profile. There is not much up there — a rotation lower would start to clean it up.
Range: I expect us to stay within roughly a 200-point bracket — about 7574 down to 7374 on ES — for most of, if not all of, the week as we clean up inefficiencies. This is a chop-and-fill week, not a runaway week.
Structure: It all comes down to the 7527 daily on ES. Above it, we are essentially bullish; below it, we shift to momentum weakness and rotate down to fill the inefficiencies. Above 7574 invalidates the near-term down-rotation, and above the very-tested 7596 weekly, the upside opens back up.
Trend: Up on all timeframes. I am not bearish here — even a rotation lower keeps us up, and we are always looking for a dip to buy. These freshly-cleared daily levels with four-hour confluence are exactly the high-probability setups we have been waiting on. Buy the dip until the chart says otherwise.
🧠 Current Market Context
The Post-Rollover Reset & The 7527 Decision Point
Now that rollover is out of the way, the picture is clearer than it has been in weeks. We are up on all timeframes, we played massive support and got a nice pop, and we are sitting right in our major resistance heading into Monday. The entire week pivots on a couple of decision levels, and the structure between SPX and ES lines up nearly perfectly.
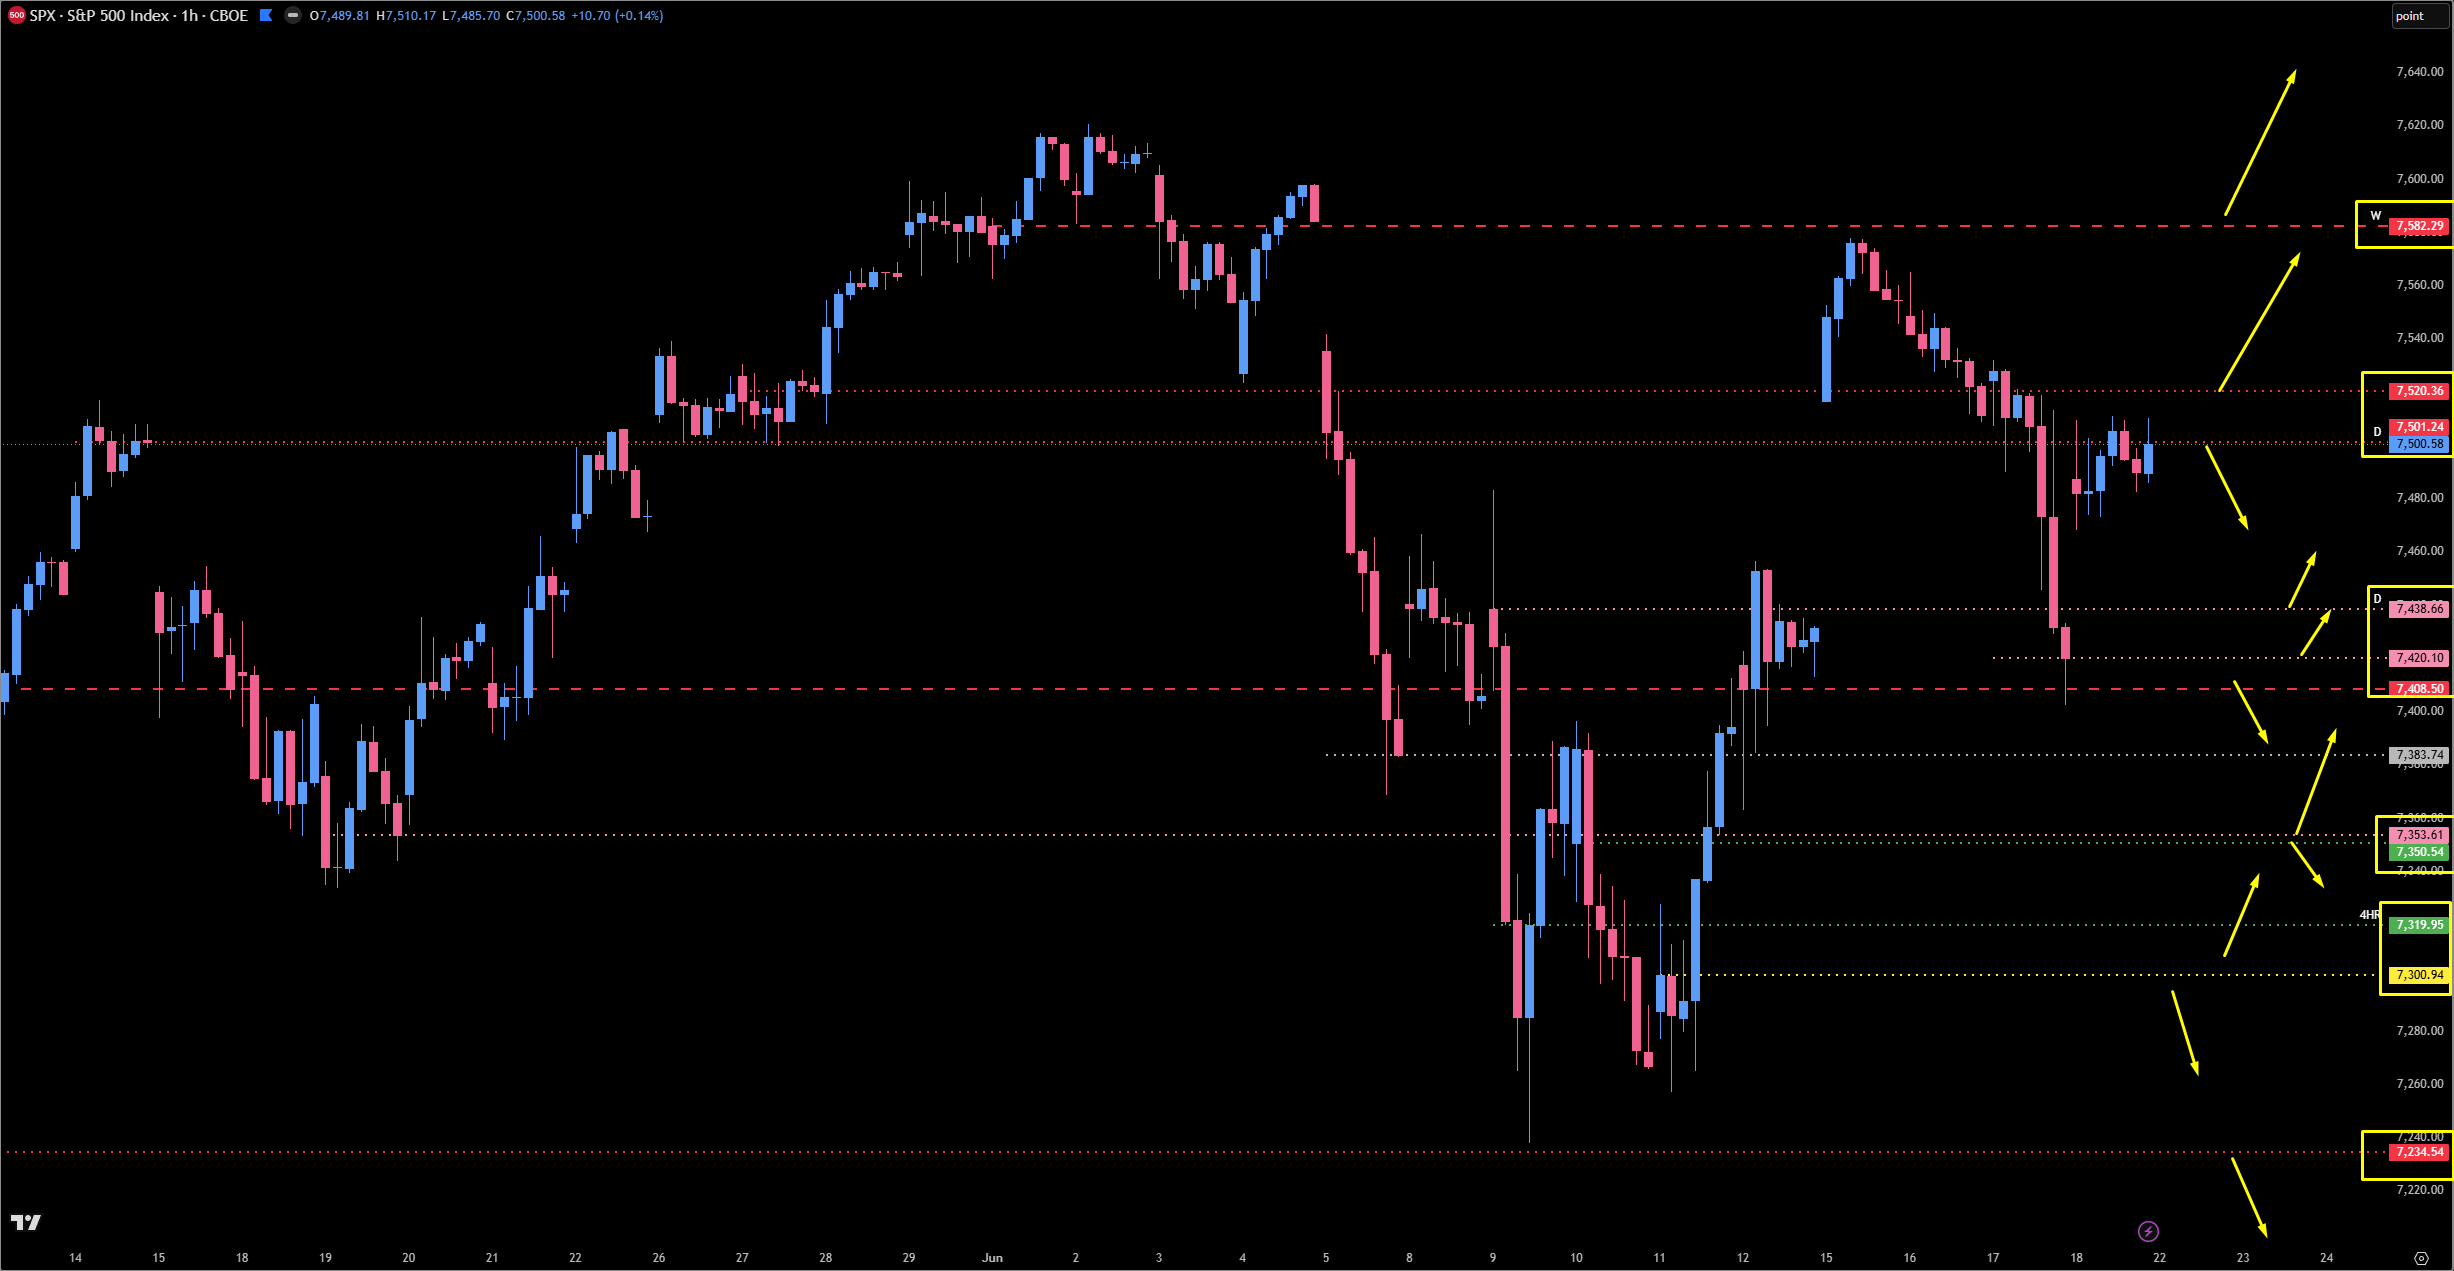
On SPX, we played massive support at 7408 for a nice pop and now sit directly in our major resistance at 7501 — the daily I have called our dividing line for more up or down so many times. It continues to be everything: above 7501 and truly above 7520, we can send right back to all-time highs, with the weekly at 7582 (it missed by about five points, but I will call it tested since it is a weekly and that is close enough) as the next reaction before fresh price discovery. Below 7501, I am not ultimately bearish, because we are up on all timeframes and have massive support below. The two important daily levels first are 7438.66 — the top-down daily we were short on, where I said we would either pop or fade (that was Friday, then that Sunday we gapped way up) — and 7420, which I like a little less than 7438 but will not ignore. Below those, we could come all the way down to 7353, a massive support I have liked for quite some time, and it looks even sexier on ES. Quick recap: below 7501, watch 7438 / 7420 and potentially 7353; above 7501, push above 7520 into 7582 and potentially all-time highs.
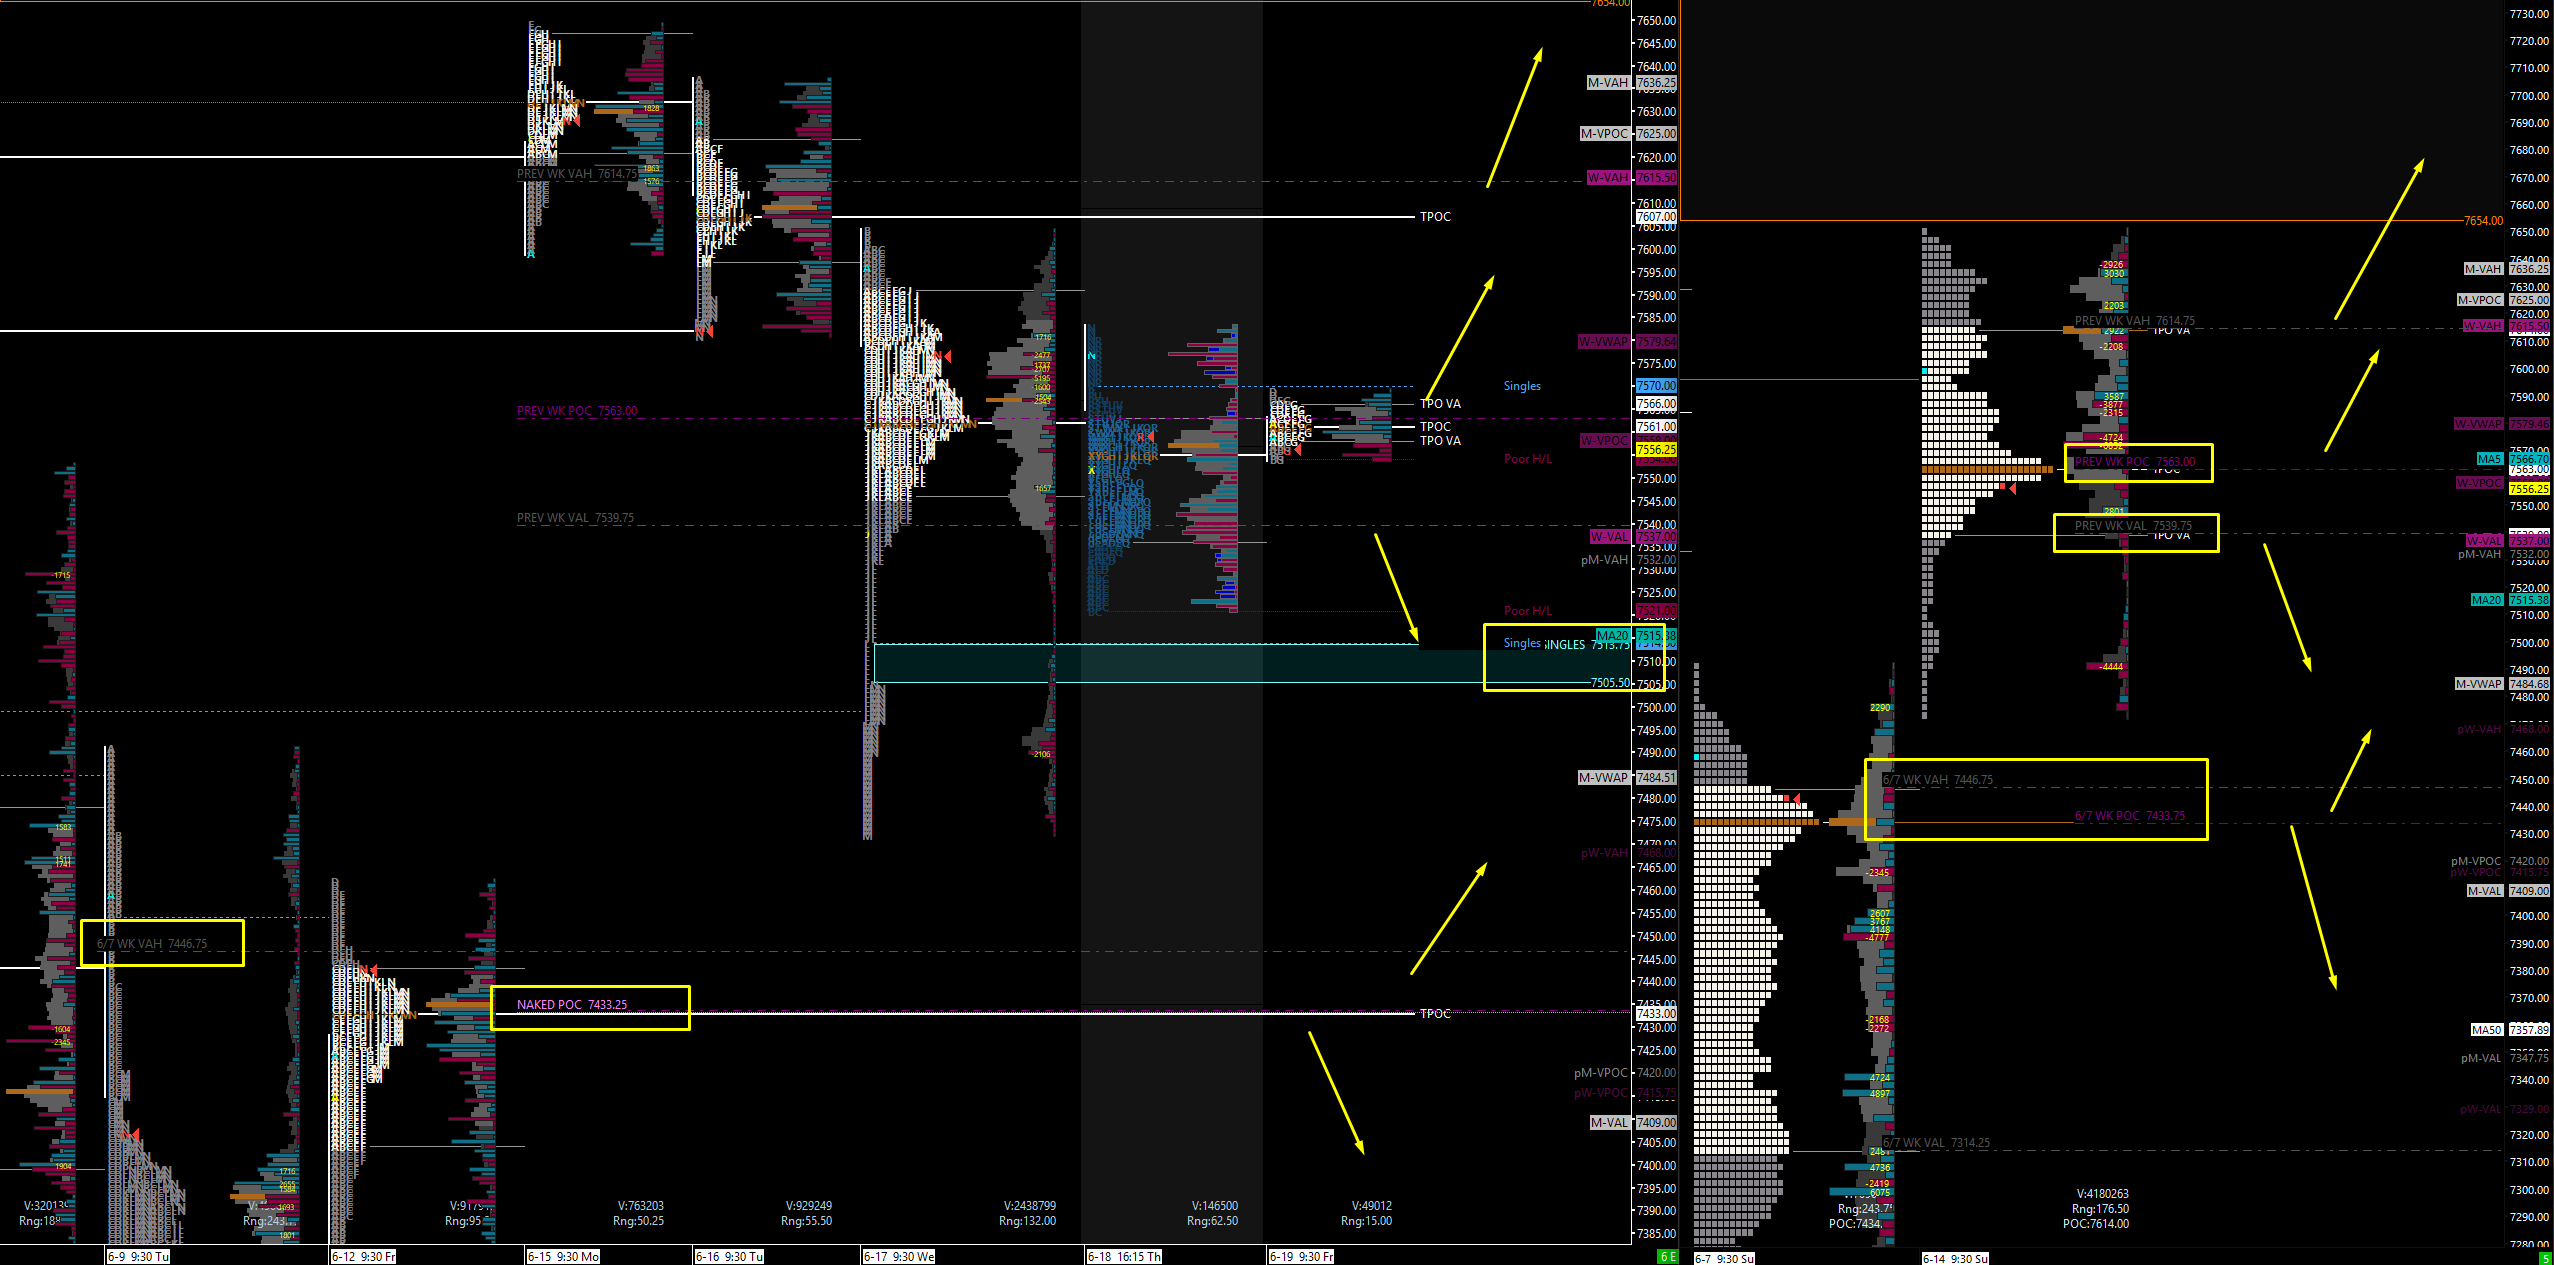
On ES, the weekly TPO tells the story. We still have a massive bullish imbalance up at 7797 — that does not mean we clean it up this week or next, but if we start traversing all-time highs again, it is a serious target. We closed Friday below the weekly point of control, and we really need to stay above 7539 to keep this upside momentum. But honestly, if they come lower, I would love it — below 7539 we rotate down and start cleaning up that low-volume inefficiency, which brings us into the area I really like: the 7433 naked daily point of control from 6/7 and the 6/7 value area high around 7446.75. The daily profile also left a big batch of singles from 7513 to 7507, and a gap at 7505 that there is no reason price can’t come down and fill at a minimum. We are starting to push value down a touch, which hints we could traverse a little lower first — and that is okay, because we are always hunting a dip to buy.
🎯 Detailed Actionable Trade Plan (ES Futures)
It all comes down to 7527 — the big make-or-break daily that needs to keep us propped up. Above 7527, we are bullish; below it, we shift to weakness, fill the gap and singles, and rotate down into the deeper buy zones. My near-term resistance and personal short trigger is 7574 (the four-hour leg down); above 7574, and ultimately above the tested 7596 weekly, the down-rotation is off the table. The premier long zones below are the 7456.25-7458 daily/four-hour confluence and the 7404.50-7418.75 “bee’s knees” shoulder. Below the 7404 shoulder, it gets hairy fast.
My Personal Setup for the Week: I like the 7574 short with a stop just above the previous day’s high — only about an 8-to-10-point risk. T1 is the 7527 area (~50 points), and if they lose 27, my final target T3 is 7458, paying well over 100 points (about 110) from the short. It all comes down to 27: lose it, and we rotate down to the 7458 area where I expect a reaction and get flat. It all goes bad above 7574 — that invalidates the trade — but for an 8-to-10-point stop and a couple-hundred-point potential, I have to give it a shot. I still think we go up; I just think we rotate first.
🔴 Key Resistance Zones & Setups
The Make-or-Break Resistance & Short Trigger: 7574.00
7574.00 (Four-Hour Leg Down).
Context: This is the great four-hour leg down and my key overhead resistance coming into Monday. As long as we stay below 7574, I think we rotate all the way down into the 7525-7527 area. This is also my personal short trigger for the week.
Actionable Setup: Short Setup: If price pushes up into 7574 (even in Globex), short with a stop just above the previous day’s high — roughly 8-10 points of risk — targeting 7527 first. Whether 7574 is tested or untested on the touch determines the reaction: if tested, expect a small head-bump and potential continuation up; if untested, we may get more downside off of it.
Warning: It all goes bad above 7574. A clean reclaim invalidates the down-rotation thesis and points us back toward the weekly above.
The Tested Weekly Ceiling: 7596.00
7596.00 (Very Tested Weekly).
Context: This weekly is very much tested, so we could push right through it. Above 7574 we come up here, and above 7596 is where I would start to say this is certainly not coming back down.
Actionable Setup: Above 7596, the upside is clear and the bullish imbalance up at 7797 becomes the longer-term target. Treat 7596 as the line that confirms the breakout if reclaimed with acceptance.
🔵 Key Support Zones & Setups
The Big Make-or-Break Daily: 7525.00 - 7527.00
7527.00 (Major Daily — Make-or-Break), 7525.00 (Zone Low).
Context: This is the big daily we have talked about many, many times — the one that comes all the way from the left of the chart. 7527 is our make-it-or-break-it right now. As long as we stay above it, we are essentially bullish; below it, we start to see a shift in momentum and a little weakness. This is the level that needs to keep us propped up, and it is the determining factor for the whole week.
Actionable Setup: Look for 7525-7527 to play or at least hold for now. If they come down and play 27, look for a reclaim back above the wick around 7532, then take some profits around 7542 — a reclaim of 7542 opens continuation higher.
Warning: If we lose 7527, we come down to fill the gap and singles and rotate toward the deeper supports. This is the single most important level on the board.
The Singles & Gap Fill: 7505.00 - 7513.00
7513.00 - 7507.00 (6/17 Profile Singles), 7505.00 (Unfilled Gap).
Context: The 6/17 daily profile left a big batch of singles running from 7513 to 7507, and there is an unfilled gap at 7505. There is no reason price cannot come down and clean these up — I would expect this area to get filled at a minimum.
Actionable Setup: Treat this as a magnet/fill zone on a rotation lower. Filling 7505-7513 is the natural first stop below the make-or-break before the bigger buy zones engage.
The Rollover Daily: 7492.50
7492.50 (Daily / One-Hour — Created During Rollover).
Context: This daily was created during rollover and really did not gain anything, so I do not love it — but it is both a one-hour and a daily level, so from a process perspective I will not ignore it.
Actionable Setup: If I am short into this, I will be taking profits here rather than looking to get long. It is a take-profit marker, not a high-conviction buy.
The Phenomenal Long — Daily/Four-Hour Confluence: 7456.25 - 7458.00
7458.00 (Untested Daily), 7456.25 (Four-Hour).
Context: This is the area I really like. We have an untested daily at 7458 stacked with a four-hour at 7456.25 and another four-hour right here — two four-hours and a daily all in confluence. This is a phenomenal spot to look for a long, and it is the final target (T3) of my personal short.
Actionable Setup: Buy Setup: Look for this zone to play, then we want to see price get back above the wick with confidence — I mean a 10-to-15-minute close right above it — before triggering the long. Once it regains the wick with confidence, look for a potential squeeze higher. Above 7434 and ultimately back above this confluence, we head higher.
The Naked POC & Value Area High: 7433.00 - 7446.00
7446.00 (6/7 Value Area High), 7434.50 (Daily), 7433.00 (Naked Daily POC).
Context: This is the juicy market-profile support I flagged on the weekly TPO. The 7433 naked daily point of control lines up perfectly with the 7446 value area high, and there is a daily at 7434.50 right in the mix. I love to rotate down and play some of this support from a market profile perspective — it is a juicy spot. That said, I would not buy the 7434.50 daily blindly; the risk-to-reward there is a little sketchy since it sits right in the middle between the levels I really like.
Actionable Setup: Conditional Long: If price rotates into 7433-7446, look for a reaction off the naked POC / value-area-high confluence. For the 7434.50 daily specifically, wait for a reclaim back above the 7456 confluence before triggering — I would rather miss 20 points and know I am in the right trade.
The Bee’s Knees Shoulder: 7404.50 - 7418.75
7418.75 (Wick Trigger), 7414.00 (Daily), 7410.75 (Four-Hour), 7404.50 (Four-Hour Leg Up).
Context: This is the bee’s knees — my favorite section on the entire board. We have a beautiful shoulder here with a weekly, a daily at 7414, a four-hour at 7410.75, and a four-hour leg up at 7404.50, plus a gorgeous little wick down at 7418.75 that gives me a clean trigger. The 7410-7404 section is super-duper sexy: a four-hour leg, a trigger to get long off of, and full timeframe confluence. This is the area I really want to see play if we are going to continue higher.
Actionable Setup: Buy Setup: Look for this zone to play and get back above the 7418.75 wick before triggering the long. Above 7434 and then ultimately 7456, this thing takes us all the way to the promised land.
Warning: Below 7404, it gets hairy and it gets hairy fast. We really want to see this shoulder hold to continue the move higher.
The Tested Leg to All-Time High: 7374.00
7374.00 (Tested Dailies — Wiped).
Context: These are the dailies down at 7374 we played multiple times — the actual leg to the all-time high that propelled us back up. They played beautifully from both the bottom and top side, but now these areas are tested and wiped, so I would not be looking to play them again.
Actionable Setup: Reference level only. Below the shoulder, this is where the structure has already given up its juice — do not lean on it as fresh support.
The Momentum Shift Pivot: 7336.00 - 7350.00
7350.00 (Four-Hour), 7344.00 (50-Day Moving Average), 7336.00 (Tested Four-Hour — Top-Down).
Context: Below the shoulder, it gets shifty, but I have a couple of four-hour levels here I would not ignore — I like them a lot, especially the 7350 and the 7336. The 7336 is the tested top-down level I like, and it sits right with the 50-day moving average at 7344, which could get some love. My concern: once we are under 7404 (the leg to the all-time high), we have serious overhead resistance, so this becomes our big momentum shift pivot.
Actionable Setup: Conditional Long: If we come down and play the 7336 with the 50-day MA confluence, look for a reaction. But respect that below the leg to the all-time high, the structure has shifted — require confirmation before sizing up.
The Last Nasty Level: 7284.00
7284.00 (Final Support).
Context: This is the very last nasty level down here. Do I think it plays? Absolutely — I think it could play all the way back to 7336. But I do not think it saves it; I think it gets a reaction and that is probably about it. I did not go any farther down because I do not believe we move any lower than this all week.
Actionable Setup: Expect a reaction at 7284 if we get there, but treat it as a bounce candidate, not a structural floor. This is the bottom of my expected 200-point bracket for the week.
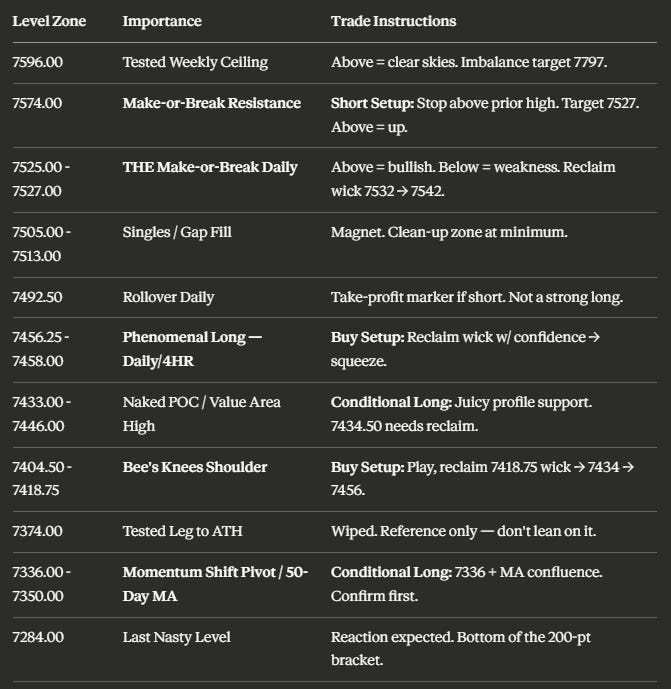
📌 Cheat Sheet – Key Levels Recap
🧠 Final Thoughts
Now that rollover is finally behind us, we have real structure to play, and the read could not be cleaner. It all comes down to 7527 — above it we stay bullish, below it we shift to weakness, fill the gap and singles, and rotate down into the buy zones. I expect us to spend most of the week inside a roughly 200-point bracket between 7574 and 7374, cleaning up inefficiencies, and the beautiful part is that we now have a whole gang of daily levels with four-hour confluence — and those daily levels produce massive moves of 40, 50, 60, 100 points or more. This is our chance to buy the dip and really get some action.
My personal play is the 7574 short for an 8-to-10-point risk, targeting 7527 and ultimately 7458 for well over 100 points — it all goes bad above 7574, but the risk-reward is too good to pass up. On the buy side, my favorites are the 7456.25-7458 daily/four-hour confluence and the 7404.50-7418.75 bee’s-knees shoulder — wait for the wick reclaims before triggering. Below 7404 it gets hairy, with the 7336 tested four-hour and 50-day MA as the momentum shift pivot, and 7284 as the last nasty level and the floor of our bracket. On SPX, mirror it: 7501 is the dividing line, 7353 is the big support below, and above 7520 we are gunning for 7582 and all-time highs. Stay patient, respect the pivots, and let these high-probability daily setups come to you.
We have had a massive influx in the Inner Circle this week, and the whole team in there is just crushing it — putting up numbers like Jordan. If you are a Substack subscriber, hit me up in the DMs, come check out the room, and I will take care of you. Enjoy the rest of your Sunday — Monday is a new day. I will see you for the post-market breakdown, and your trade plan will be out Tuesday at 8:30 in the morning. We are going to slam dunk on Monday.
Until next time—trade smart, stay prepared, and together we will conquer these markets!
Ryan Bailey, VICI Trading Solutions.
📊 TradingView Indicator String
Copy and paste the levels below into your S&P Edge Levels indicator to automatically plot today’s key levels on your chart:
7596.00|Tested WK|TW
7574.00|4HR|4H
7527.00|D|D
7492.50|D|D
7458.00|D|D
7456.25|4HR|4H
7434.50|D|D
7414.00|D|D
7410.75|4HR|4H
7404.50|4HR|4H
7374.00|Tested D|TD
7350.00|4HR|4H
7336.00|Tested 4HR|T4
