Welcome back, everybody, and congratulations for sticking to the trade plan this week. We had an amazing week, proving it out day after day in the post-market breakdowns. We had an incredible, extreme market-changing volatility event on Friday with a massive amount of red tag news, capped off by the Trump tariffs getting shot down.
A Note on This Week’s Market Catalyst:
The Catalyst: Trump tariffs were shot down, sparking a massive relief rally.
The “Why”: The market loved this news. No tariffs reduce multinational reliance on foreign supply chains and reduce price pressures.
Fed Impact: Tariffs add to inflation; their removal aids the Fed’s cut outlook, potentially giving Jerome Powell the green light to cut at a faster pace without the pressure of unprecedented tariff data.
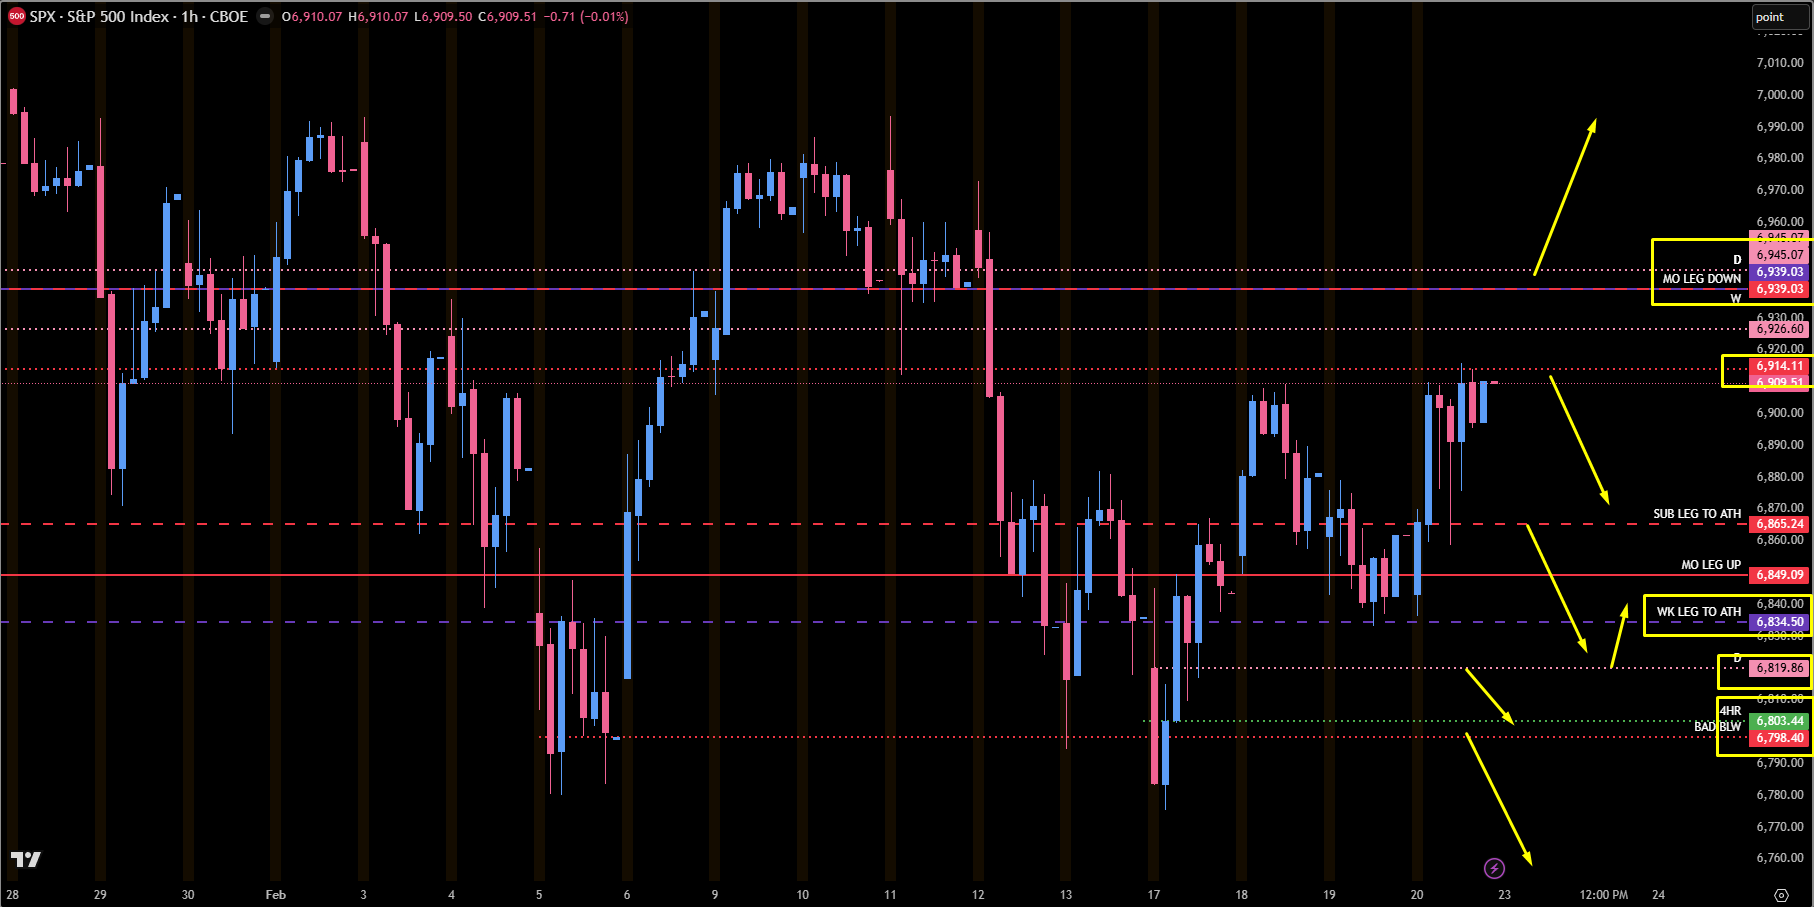
Trend: ES technically lost structure on the Daily and Weekly, but SPX held the line, keeping the bullish thesis alive.
🧠 Current Market Context
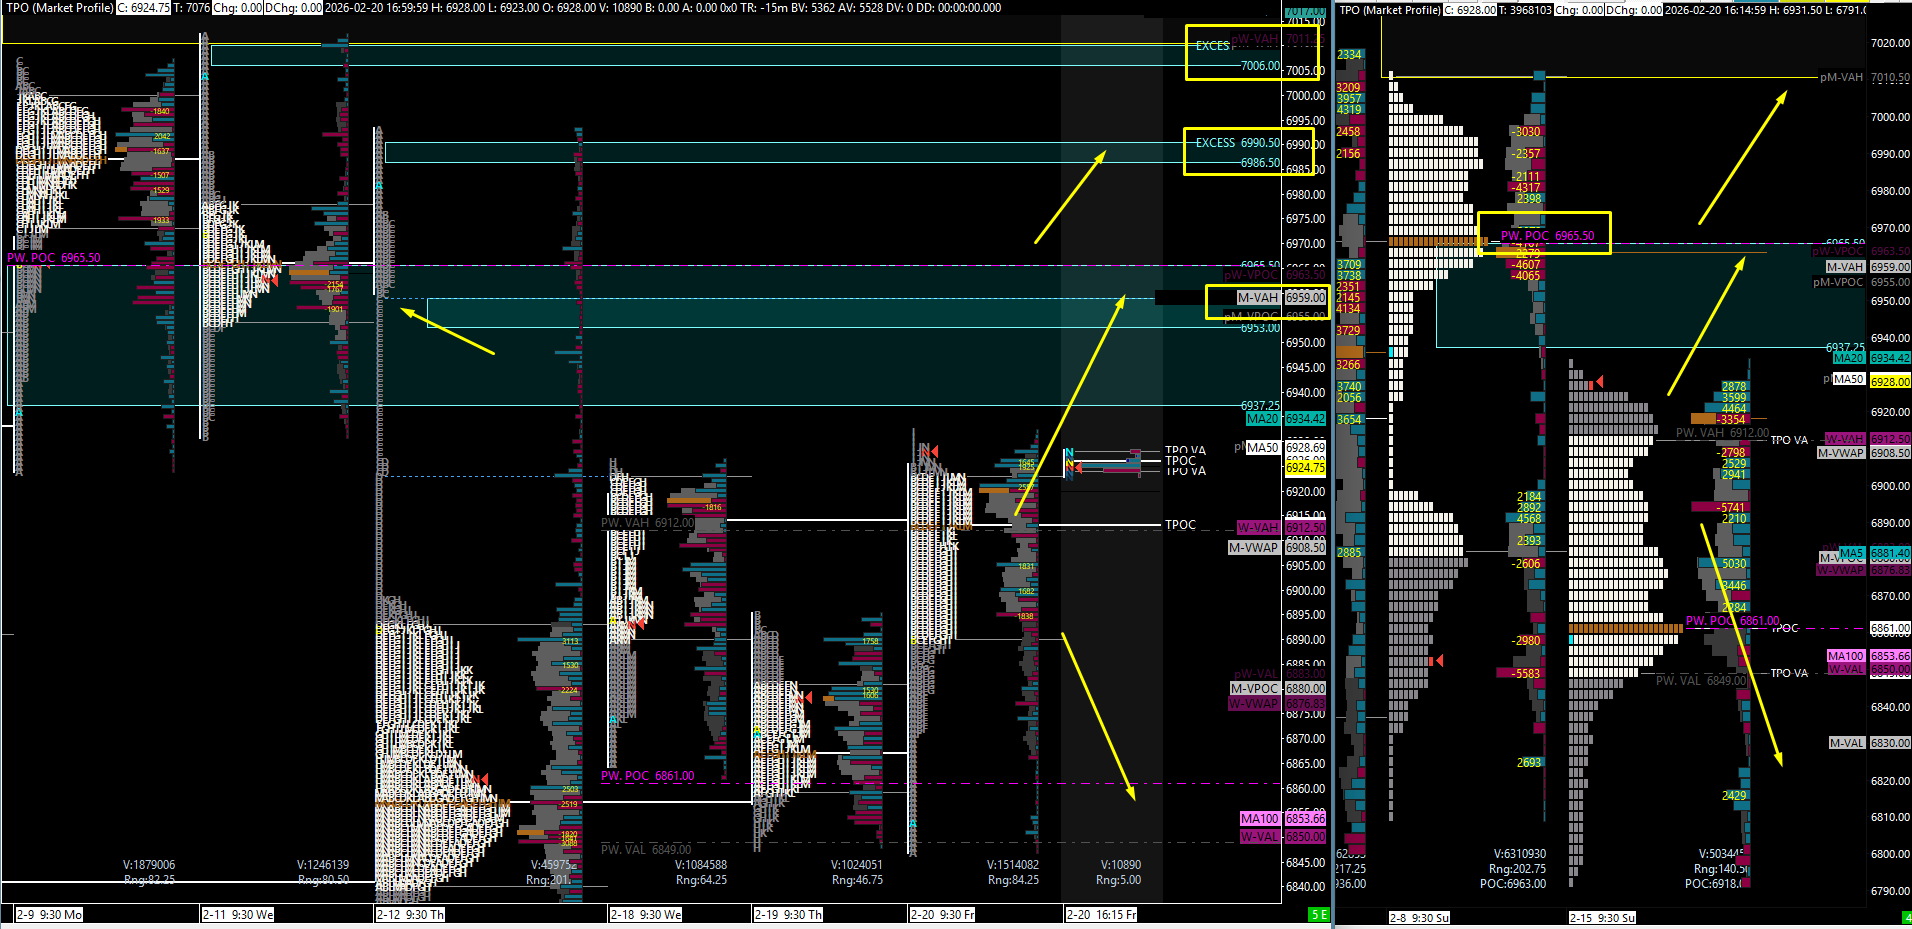
We have to temporarily change our bias with the data, and right now, we are currently moving up. We have built out super nice acceptance on the weekly timeframe, balancing in these overlapping value areas. We swept the weekly lows earlier this week, reclaimed our major pivots, and filled the structure back in.
We have a massive bullish imbalance all the way up to 7084.00. That is another 150+ points from where we sit. While it may not happen this week, all signs point to more upside as we have a huge inefficiency on the upside that needs to be completed.
📊 SPX Analysis: The True Guide
There is a stark contrast between ES and SPX right now. ES lost its daily leg, but SPX never lost the weekly or daily leg to the all-time high. Because SPX is the true index, we are using this as our guide.
The absolute “make it or break it” spot for the entire market is SPX 6939.00 (Monthly/Weekly level). If we pop 6939.00 on SPX, we continue to make new all-time highs. If they reject from here, we could come down quite significantly.
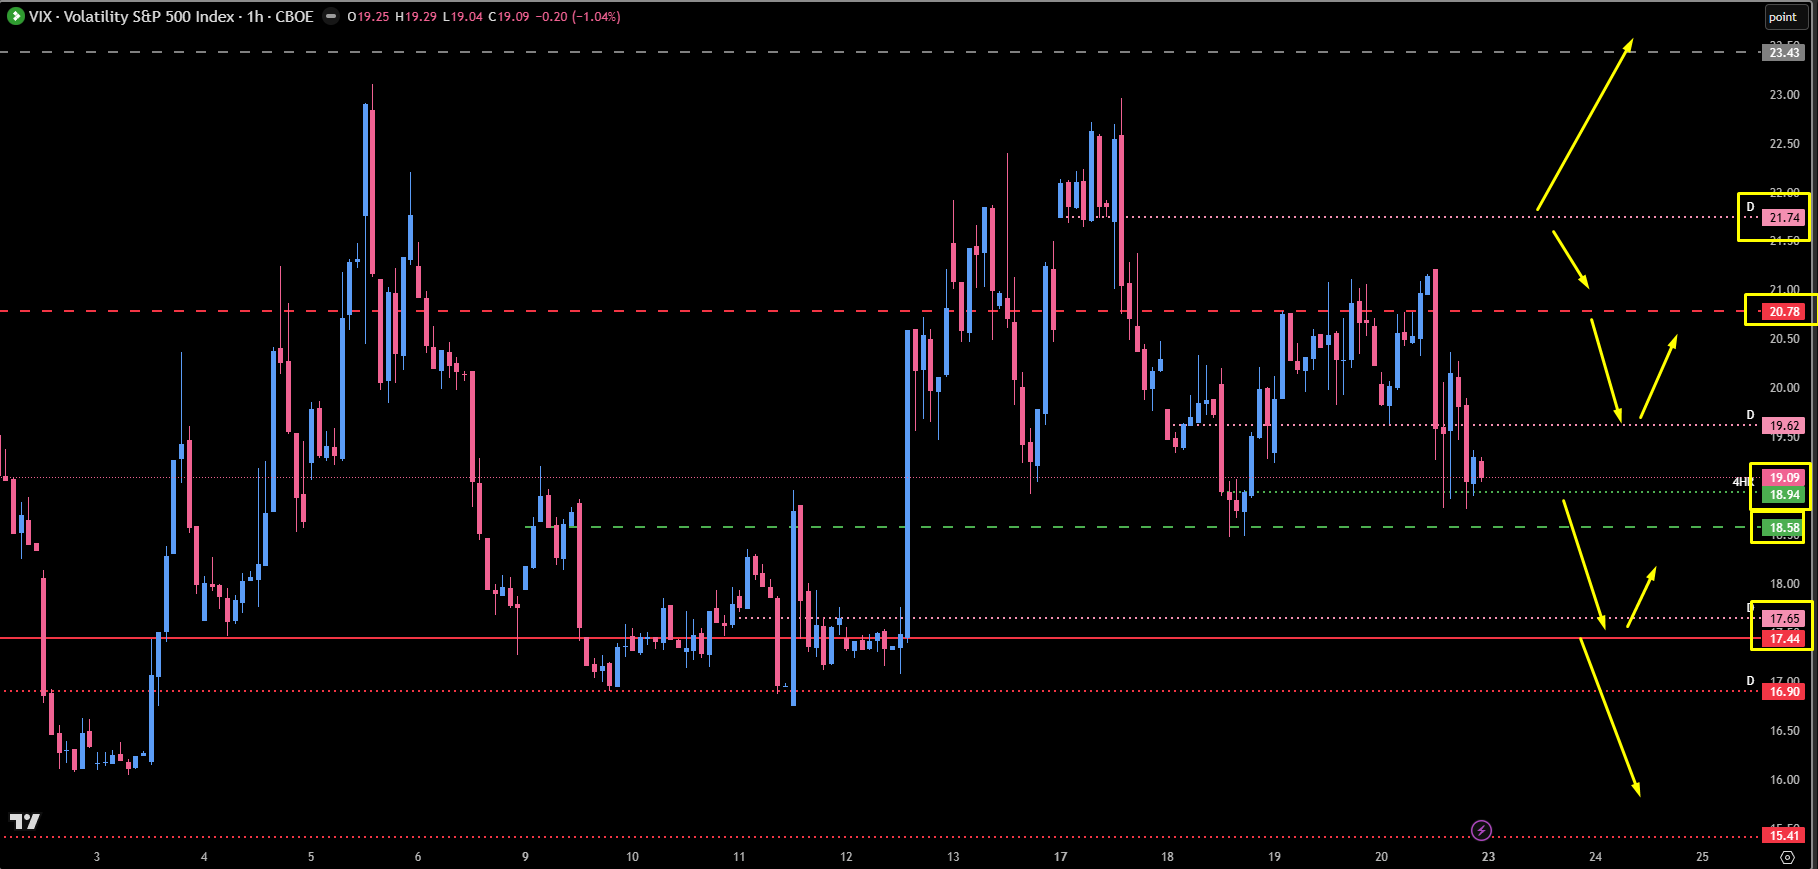
🚨 VIX Analysis: The 17.65 Target
VIX has been flirting with the $20 handle, but with the geopolitical shift news, it is looking to come down to give the indices relief.
The Pivot: 19.62. We played this Friday, created a double top on the 1-hour, and are pulling down.
Downside Target: 17.65 (Untested Support). I expect a reaction here, though I don’t expect it to hold long-term.
Headwind Risk: The massive untested Daily level at 21.74 remains above us if things flip.
🎯 Detailed Actionable Trade Plan (ES Futures)
We are using the SPX structure to guide our ES trades, watching the massive inefficiency fill above and key weekly pivots below.
🔴 Key Resistance Zones & Setups
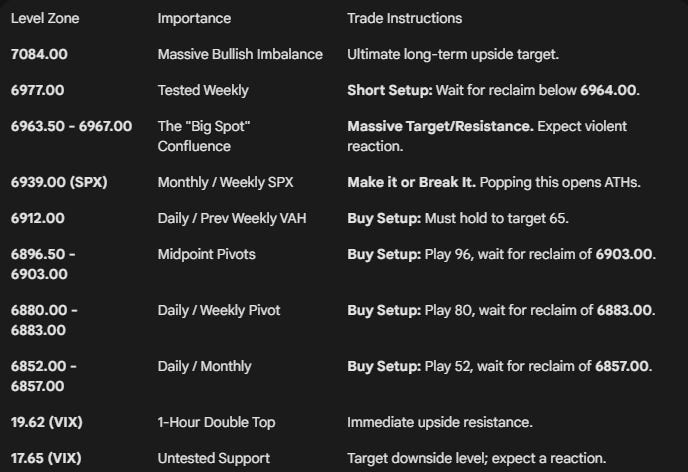
The “Make It or Break It” Confluence Zone: 6963.50 - 6967.00
Levels: 6963.50 (Monster Monthly / Daily / Weekly POC), 6964.50 (Daily), 6965.00 (Inefficiency Target), 6967.00 (4-Hour).
Context: This is the massive area of resistance and our main target. Look at the selling volume here. I absolutely believe we will get a reaction here.
Actionable Setup: This is a primary target for longs and the main zone to look for a violent rejection.
The High-Risk Weekly: 6977.00
Levels: 6977.00 (Tested Weekly).
Context: If we push above 6964.00, this is the sleeper level.
Actionable Setup: Conditional Short: If you want to short this push, wait for price to get back below 6964.00 before initiating the trade. Do not short underneath this support blindly.
Higher Timeframe Targets:
6986.50 (Highest Untested 4-Hour).
7004.00 (Tested Level - expect a slight reaction).
7084.00 (Ultimate Bullish Imbalance Target).
🔵 Key Support Zones & Setups
The Trend Anchor: 6912.00
Levels: 6912.00 (Untested Daily / Previous Weekly VAH).
Context: As long as we hold this, we target up to 6965.00. Look for a pullback and a pop.
The Midpoint Pivots: 6896.50 & 6903.00
Levels: 6903.00 and 6896.50 (Midpoint Pivot / Weeklies).
Actionable Setup: If 6896.50 plays, look to get long only back above 6903.00 for continuation.
The Major Pivot Zone: 6880.00 - 6883.00
Levels: 6880.00 (Daily) and 6883.00 (Weekly).
Actionable Setup: Look for 6880.00 to play, but wait to get back above the Weekly at 6883.00 before getting long.
Deep Daily Support: 6852.00
Levels: 6852.00 (Daily) and 6857.00 (Monthly).
Context: I am not a huge fan of this level, but it is there.
Actionable Setup: If 6852.00 plays, wait for price to get back above the Monthly at 6857.00 before buying.
📌 Cheat Sheet – Key Levels Recap
🧠 Final Thoughts
The market digested the Trump tariff rejection with a massive relief rally, completely shifting our bias with the new data. We have a massive inefficiency above us that acts like a magnet, and as long as SPX holds its structural legs, we are looking for more upside. Do not step in front of this train blindly at resistance—let the actionable setups prove themselves. Know your pivots, monitor the 6939.00 SPX level, and let the charts tell us what to do.
Until next time—trade smart, stay prepared, and together we will conquer these markets!
Ryan Bailey, VICI Trading Solutions.
WK/DAY TPO