

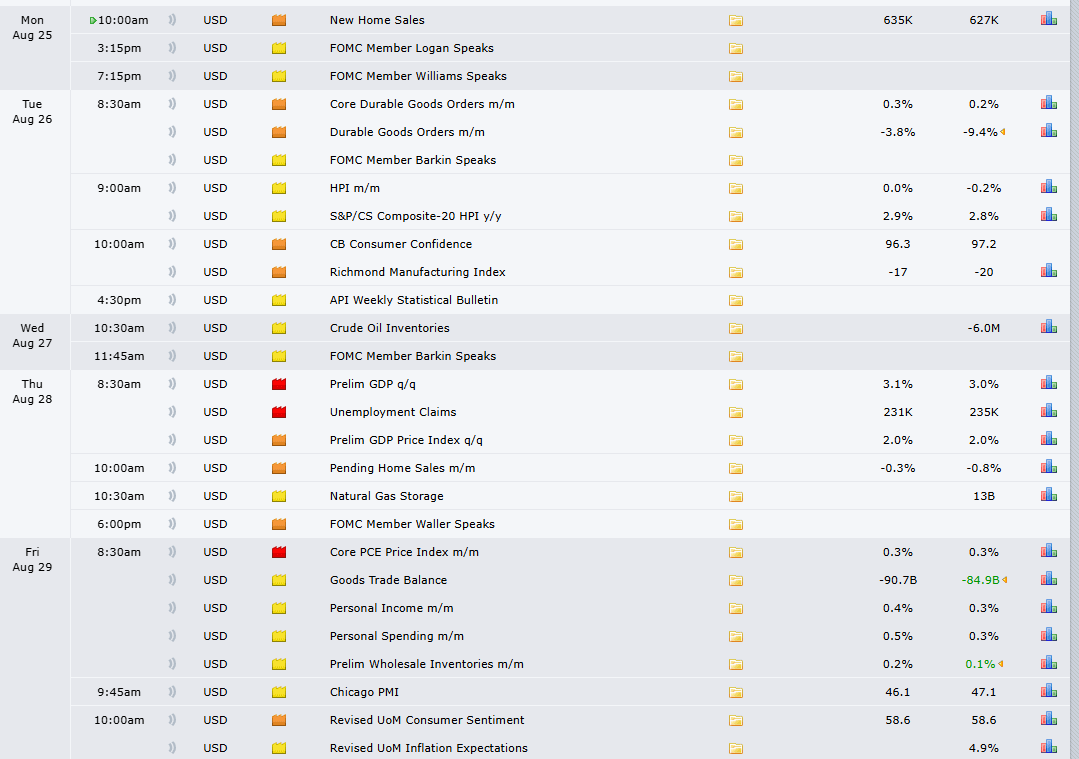
Scheduled Weekly News:
Welcome back, everyone. I am Ryan Bailey, and this is the Weekend Review for Sunday, Week of August 24th.
Friday was an absolutely insane day. The market waited patiently for Fed Chair Powell to speak from Jackson Hole, and the moment he insinuated rate cuts were on the table, we launched. The S&P 500 pumped 100 points in a matter of minutes, taking us to within just 20 points of a new all-time high. The daily and weekly trends are still very much up, and with the current all-time high having been made in a Globex session, a "repair" to the upside is highly probable.
Let's break down the new structure and map out our plan for the week ahead.
🧠 Current Market Context:
The market is unequivocally bullish. On Friday, we rocketed up and bumped our heads on a previous daily level at 6496.75, but the underlying structure remains strong. The daily and weekly timeframes are up, and after the pump, we have now regained the 1-hour and 4-hour timeframes as well. We have not lost on any timeframe. The trend is up.
Our job now is not to fight it, but to find the best possible locations to join it on any pullbacks. The most significant development is the creation of a new daily leg up at 6413.25, which makes the 6412.00 area our new primary pivot.
It is, however, important to keep seasonality in the back of our minds. September is historically the weakest month of the year. While this doesn't guarantee a sell-off (the "sell in May and go away" mantra would have been a terrible trade this year), it is a cyclical pattern that warrants attention.
🎯 Detailed Actionable Trade Plan:
🔴 Key Resistance & Intraday Pivot
Intraweek "Make-it-or-Break-it" Pivot: 6462.00
The weekly TPO shows a significant amount of stacked blocks at the previous weekly value area high of 6462.00. This area will serve as a critical intraday and intraweek pivot. Acceptance above it keeps bulls in firm control, while a failure to hold it could open the door for a pullback into our key support zones.
🔵 Key Support Zones (Where to Look for Longs)
The "Fat" 10-Point 4-Hour Zone: 6459.25 – 6468.50
We have a thick, 10-point zone of 4-hour support just below our pivot. It's composed of three levels: the top of the leg at 6468.50, the middle at 6465.75, and the bottom support at 6459.25.
Actionable Setup: This area should hold on a first touch. A long entry here could have a defined stop below 6454.00.
Primary Buy Zone / First Absorption Area: 6412.00 – 6431.75
This is a massive, fat area of support and my primary focus. It contains the significant weekly level at 6425.00, the daily at 6431.75, our new daily leg up at 6413.25, and a big weekly absorption area. This whole area is legit for a pop.
Note: The stop on this trade is wide (around 6395.00), so you must size your position appropriately.
Lower Absorption Area / The Concern Zone: 6381.00 - 6392.00
This zone contains a 4-hour level at 6392.00 and the last 4-hour at 6381.00. It lines up with another massive weekly absorption area, a previous weekly POC, and the monthly VWAP.
Actionable Setup & Key Concern: While this area could play, my concern is that if price pushes this low, it will be extremely difficult to get back above the 6412.00 and 6431.75 pivots. A daily close under 6412.00 would be a very bad sign for bulls.
The Cautious Reclaim Setup: 6355.75
This level is now sketchy. Because the market popped over 100 points from a level just above it, I would be very cautious here.
Actionable Setup: I will not take this on a first touch. I would only consider a long if price pulls back to this level and then gets back above 6364.00 with confirmed acceptance.
The Failed Breakdown Setup: 6320.75
This 4-hour level at 6320.75 lines up perfectly with our super significant dailies at 6320.25 and 6323.50—the levels that have taken us to all-time highs twice.
Actionable Setup: This is a classic FBD setup. I'll be watching for price to test into 6320.75 and then aggressively reclaim the 6325.75 pivot. This would trigger a long entry targeting a move back to at least 6344.00-6348.00.
The Major Weekly Targets:
6302.00 - 6294.00: This zone is our first major weekly target on a deeper pullback and contains the 50-day moving average.
6268.00: This is the weekly and daily leg end. This is the more ideal spot for a major long, offering the best risk-to-reward. A long from here would look for continuation back over 6300.00.
🚨 Momentum Shift Levels:
The New Daily Leg Pivot (6412.00 - 6413.25): This is the most immediate and critical line in the sand. This is our new daily leg up. A daily close below this level would be a significant sign of weakness and could send prices much lower, as the structure below is heavily tested.
The "Must Hold" Dailies (6320.25 - 6323.50): This is the ultimate line in the sand for the larger bullish structure. These dailies have repeatedly launched the market to all-time highs.
📌 VIX Analysis: The Volatility Check
The VIX was absolutely annihilated on Friday, down 14%. This low volatility regime can change very fast.
Key Support Levels to Watch: I'm watching two main areas for a potential pop in the VIX (which would cause a pullback in ES): 13.59 (a daily leg with a nice shoulder) and 12.77 (an untested weekly).
Key Resistance Pivot: The weekly level at 14.85 is the key "above/below" pivot. If VIX gets back above this level, I would become more cautious on ES longs.
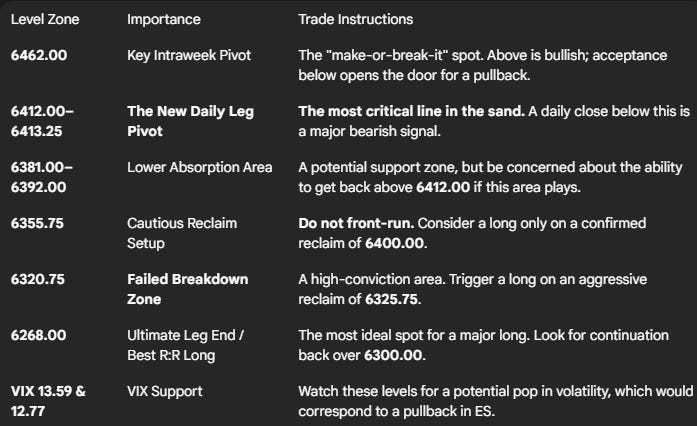
📌 Cheat Sheet – Key Levels Recap:
🧠 Final Thoughts:
The market is up, and it's strong. The most logical scenario is a push to a new all-time high, followed by a healthy pullback into one of our primary support zones, which would then serve as the launchpad for the next leg higher. I would not be looking to short this market with any real size until we see a confirmed loss on the daily timeframe, specifically a close below 6412.00. For now, we trade the chart in front of us, and the chart is pointing up.
I hope you guys have a great weekend.
Until next time—trade smart, stay prepared, and together we will conquer these markets!
Ryan Bailey, VICI Trading Solutions.

