Good morning, and welcome to the weekend review for September 28, 2025.
Looking at the high-timeframe charts, the story of this past week was one of balance. We essentially spent the entire week trading back and forth within the range of the week prior, closing dead center in its value area. This type of action is typical as the market digests a move and decides whether to accept value here or distribute for a move elsewhere. Our job is to identify the key levels that will signal which way it breaks.
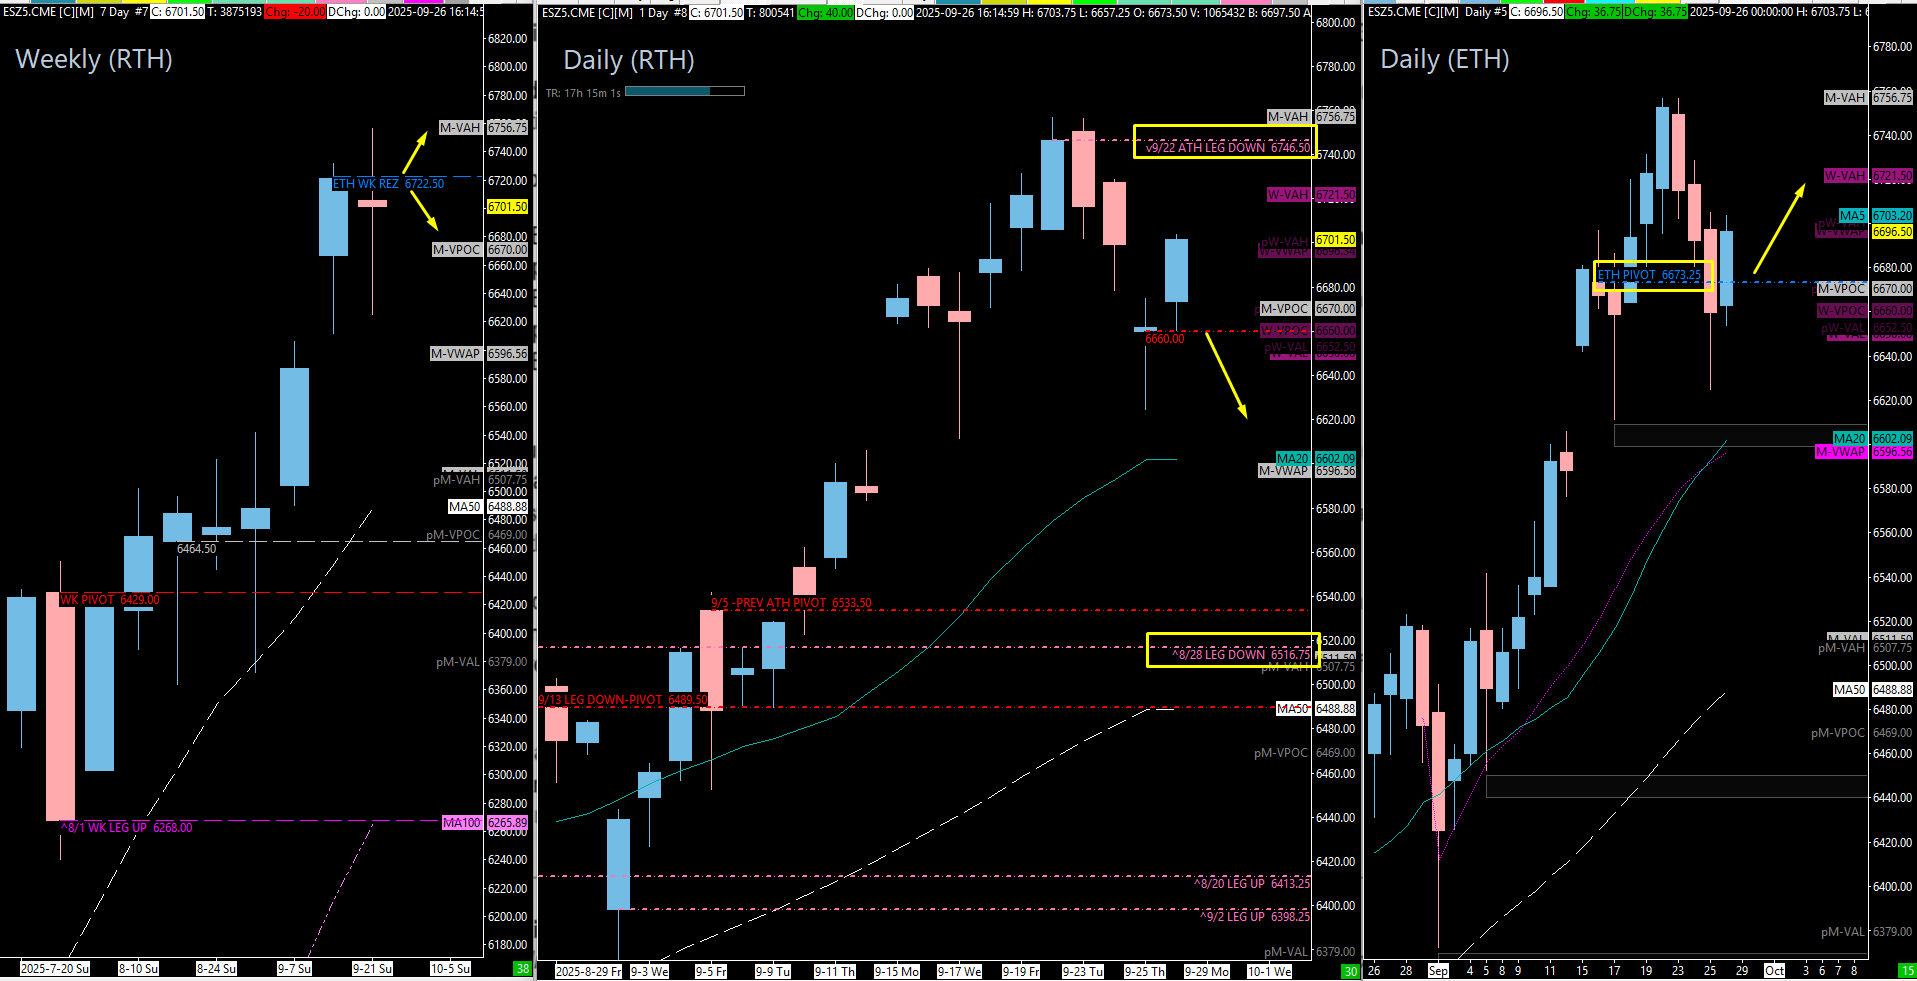
🧠 Current Market Context
The weekly TPO profile chart shows a clear double distribution, which tells us where control has shifted. More importantly, it highlights a large, inefficient area of price action overhead—a significant imbalance that extends up to 6784.00. This is a magnet for price. If bulls can maintain control, they have every reason to push higher and clean up that inefficient profile.
Structurally, the trend remains up. After making new all-time highs post-rollover, the market pulled back but successfully held the key daily leg around 6664.00. On Friday, we saw a perfect reaction from the 6660.00 daily level, which initiated the end-of-week rally.
I want to note that the recent contract rollover has made some of the cash session charts look a bit “funky.” For that reason, I am deferring to the SPX index and the Electronic Trading Hours (ETH) chart, both of which confirm that the uptrend structure has not been broken. The bullish posture remains intact.
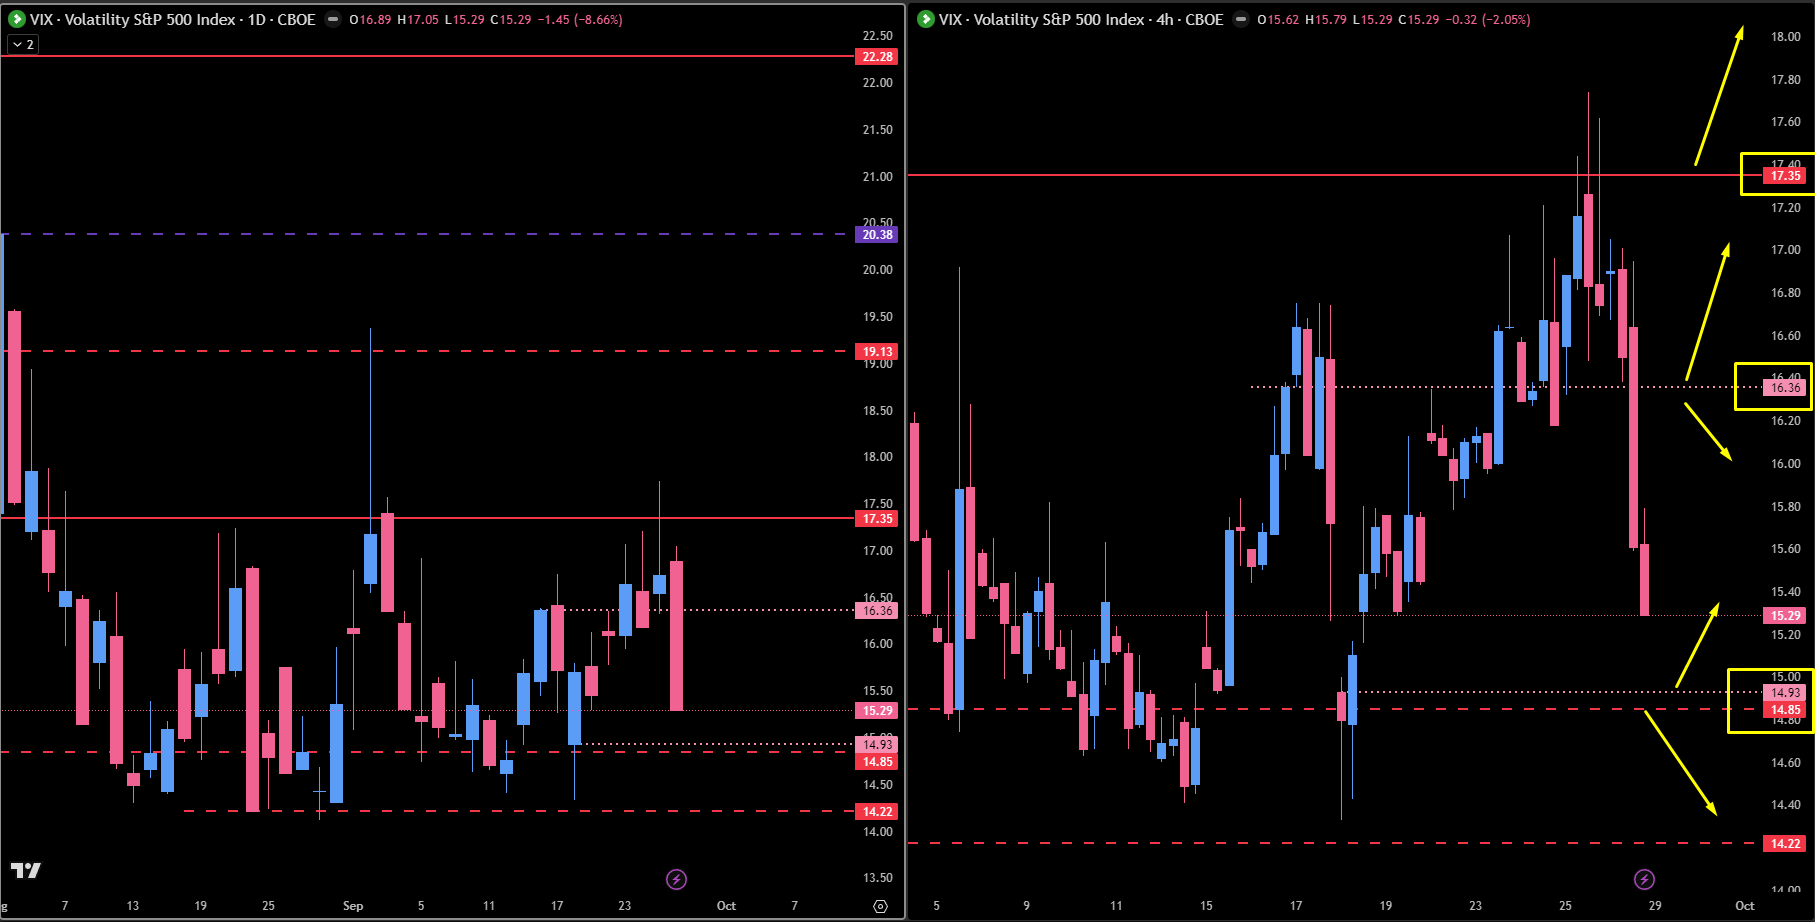
🚨 VIX Analysis
The VIX is extremely low and sitting at a critical juncture. We saw a major sign of relief for the bulls when the VIX broke below the 16.36 daily level on Friday, which fueled the afternoon rally.
Now, our focus shifts to a major support zone below, comprised of an untested daily level at 14.93 and a major weekly level at 14.85.
This 14.85 - 14.93 zone is a key contention area. I think it’s possible we see a pop from here, which would put pressure on the S&P 500 and push it down.
To maintain a bullish tailwind, we want to see the VIX stay below 16.63.
The big bull trigger: A decisive break and hold below 14.85 would give the indices a huge tailwind and could fuel a very strong push higher.
Conversely, a reclaim of 16.36 and ultimately 17.35 would signal that the market has issues.
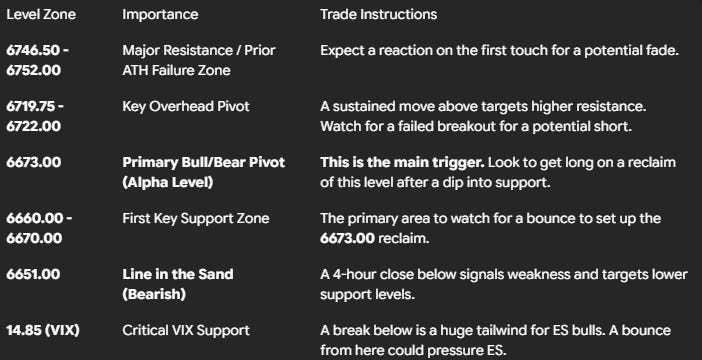
🎯 Detailed Actionable Trade Plan
🔴 Key Resistance Zones & Setups
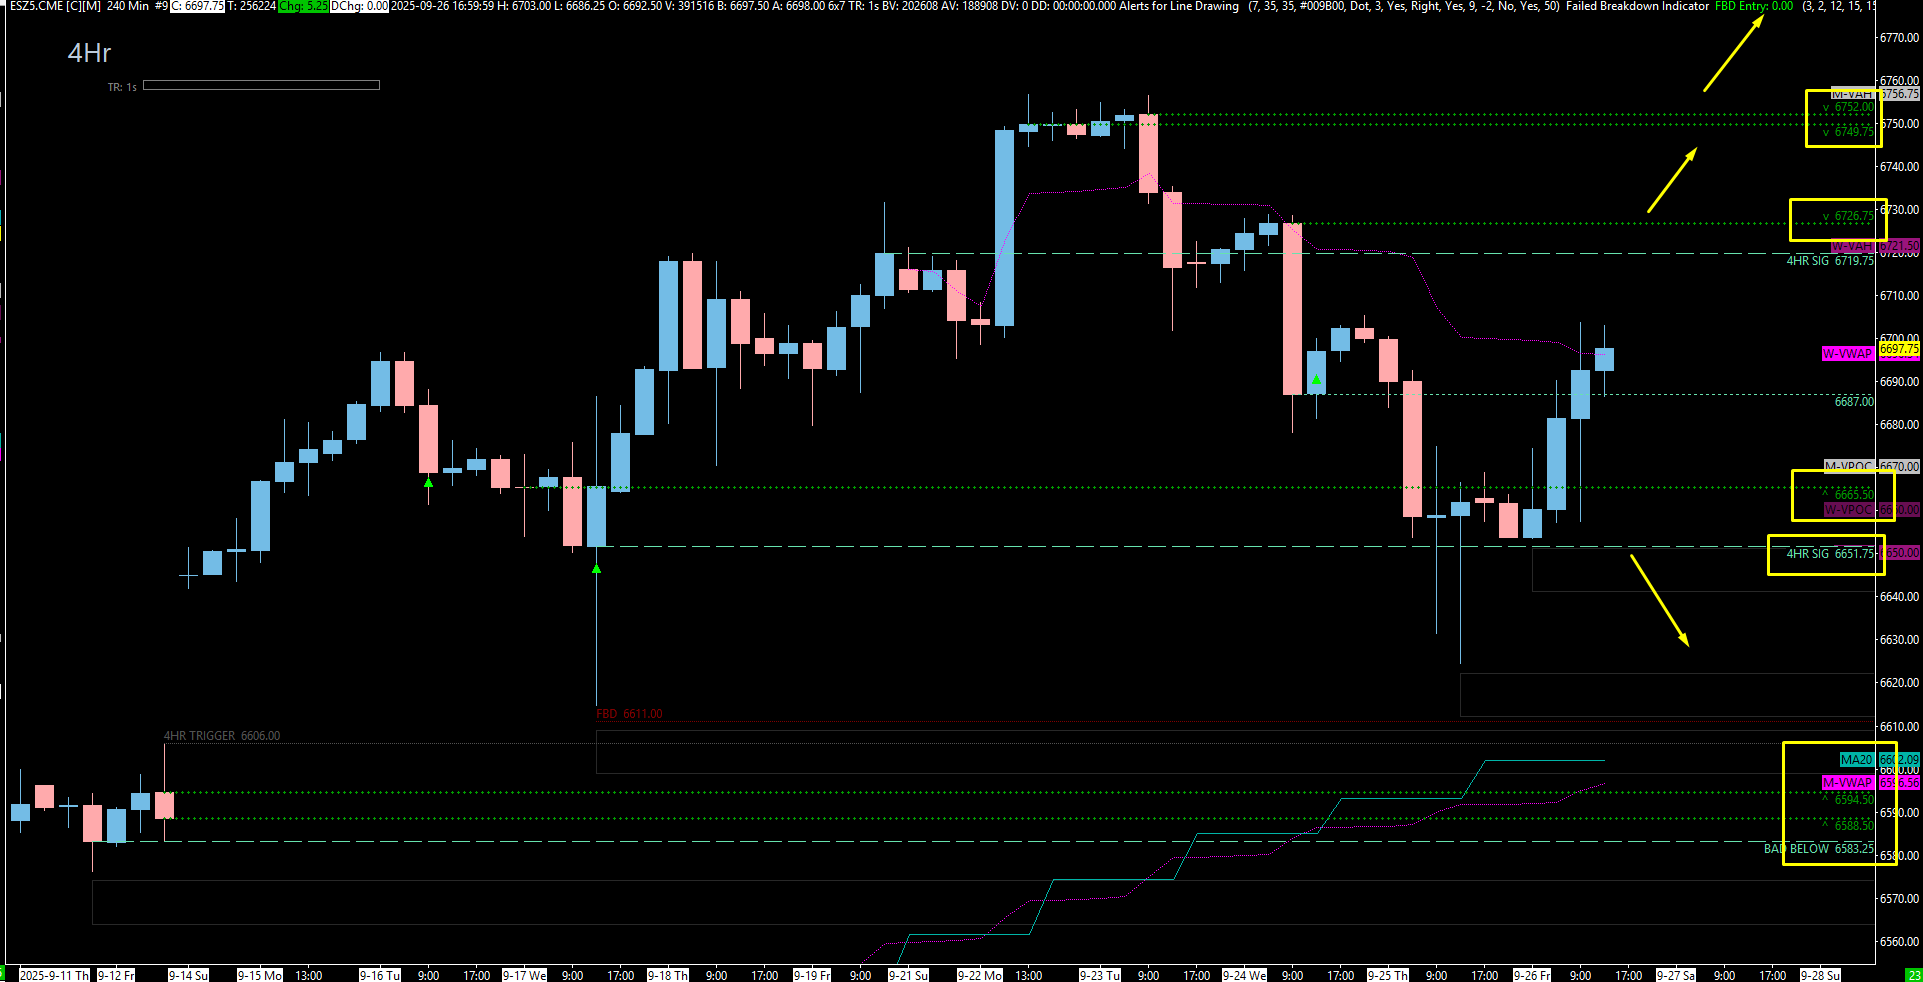
The “Make-or-Break” Pivot Zone: 6719.75 - 6726.75
This is the first big test overhead and a massive contention area. It contains the 4-hour pivot at 6719.75, last week’s value area high at 6720.00, and weekly resistance at 6722.00. We sold off hard from here before, so this is a very important spot to watch.
Actionable Setup: This sets up a great potential failed breakout. If we push above 6719.75, test into the upper part of the zone, but then fail and lose 6719.75 again, that could be a trigger for a short trade back down into support. A firm hold above this zone targets the all-time high area next.
The All-Time High Rejection Zone: 6746.50 - 6752.00
This zone contains our untested daily at 6746.50 and the 4-hour cluster up to 6752.00. This is the exact area where the market failed from the all-time highs. Normally, I’d be excited to short a level like this, but with the trend still up, we have to be cautious. I expect a reaction here, but it could just be a pullback before another attempt higher.
Actionable Setup: This is a spot for a potential first-touch fade for a quick scalp. A larger short would only be confirmed if we get this reaction and then lose the 6719.75 pivot zone below.
The Ultimate Bull Target: 6784.00
This isn’t an entry level, but our primary magnetic target. It’s the top of that big, inefficient imbalance on the weekly chart. If bulls can clear the resistance zones, they have every reason to gun for this level.
🔵 Key Support Zones & Setups
The “Awesome” Pivot Zone: 6660.00 - 6673.00
This is my favorite area on the chart, and it contains our entire game plan. The support between 6660.00 - 6670.00 lines up beautifully with multiple timeframes. But the key is the ETH Daily Pivot at 6673.00. It worked perfectly for us on Friday, and we’re going to use it the exact same way.
Actionable Setup: I am looking for a long if and only if price pulls back into the 6660.00-6670.00 support area, finds a bottom, and then gets back above 6673.00. That reclaim is our trigger to get long for a potential move to new highs.
The Bearish Line in the Sand: 6651.00
This 4-hour level is the first real sign of trouble for bulls. A 4-hour close below this level signals weakness.
Actionable Setup: This isn’t a short entry, but a warning sign. A close below here tells us to be cautious with longs and opens the door for a test of the next level down at 6636.50.
The “Be Careful” Last Line of Support: 6636.50
This is the last significant 1-hour support in this immediate area. You have to be careful leaning short into this level on a first touch because it could absolutely hold.
Actionable Setup: If this level holds and we bounce, the confirmation for a long is the same as above: we need to see a reclaim of 6651.00 and ultimately our main pivot at 6673.00.
The “Must Hold” Zone: 6583.00 - 6594.00
If the market starts losing the levels above, this is the next major battleground. The market absolutely wants to hold above 6583.00.
Actionable Setup: A daily close below 6583.00 would be a significant bearish development, likely shifting our focus to downside targets at 6507.00 and 6483.00.
📌 Cheat Sheet – Key Levels Recap
🧠 Final Thoughts
The market is coiled and ready for its next move. While we are currently in balance, the path of least resistance appears to be higher to resolve that weekly imbalance. My primary plan for the week is to be a buyer on dips. The playbook is clear: wait for a pullback into one of our defined support zones, and then enter long once price proves itself by reclaiming the 6673.00 pivot. We will let the trade come to us. Pay close attention to the VIX; its reaction at the 14.85 level could be the catalyst for the week’s big move.
Until next time—trade smart, stay prepared, and together we will conquer these markets!
Ryan Bailey, VICI Trading Solutions.
RTH WEEKLY /DAILY + ETH DAILY
4HR
VIX