

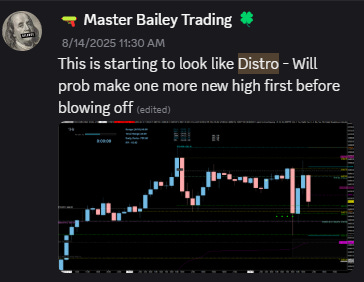
“The Market Will Prob Make One More New High First Before Blowing Off” - Thursday (8/14/25)
→ And it did on Friday morning (8/15/25) SPY 0.00%↑
I hope everyone had a fantastic weekend so far! They always go so fast and now its time once again for the weekend review where we map out the levels and build our game plan for the week ahead.
Last week was a classic case of bullish exuberance meeting bearish reality. We saw a powerful squeeze to new all-time highs, but the celebration was cut short. On Friday, the market peaked at the pre open at a new record and then sold off for most of the day, a move that looks a lot like distribution. On Thursday I mentioned that the daily close looked weak; I wanted to see a close above 6489.50 that didn’t happen, but instead, we got Fridays close at 6468.50, which doesn't inspire confidence for the next move higher. While the 6467.50 level did provide a bounce, Due to the soft close on Thursday this level was only good for about 15 points and failed to propel the market higher. This leaves the market in a vulnerable position as we head into the new week.
🧠 Current Market Context:
The most important development is the potential distribution pattern we saw forming last week. While technically, we haven't lost the uptrend on the 4-hour, 1-hour, or daily timeframes, I am starting to see cracks in the foundation.
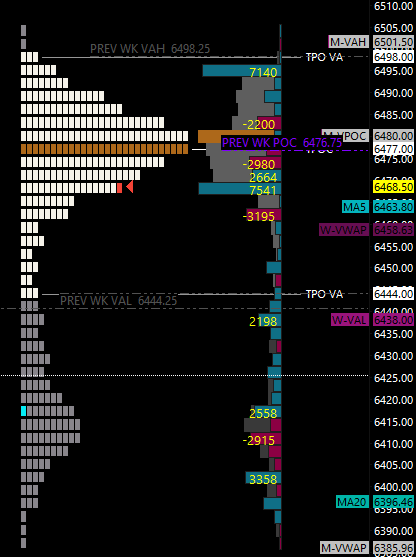
From a broader perspective, the weekly TPO chart shows what appears to be a double distribution profile, and we are currently trading on the lower side of the upper distribution. There is a significant low-volume area just below us, and I anticipate we may slip down to fill that void this week. The critical structural issue is the lack of tested support on the daily and weekly charts below our key pivot. Should the 6425.00 level fail, there is a potential air pocket that could see the market drop over 130 points to find the next major weekly support structure.
🎯 Detailed Actionable Trade Plan:
🔴 Key Resistance Zones (Where to Look for Shorts)
Sellers made their presence known on Friday, and these are the levels they need to defend to maintain downside pressure.
Immediate Resistance: 6461.00 - 6467.50
This zone contains the important daily level at 6467.50 and the 4-hour at 6461.00, which has been a "biggie" level for us. A failure for bulls to reclaim and hold this area would be a sign of continued weakness.
Actionable Setup: Look for short entries on failed rallies into this zone. A rejection here confirms sellers are still in control and targeting the support levels below.
The Upper Bracket: 6489.50
This daily level was the key line in the sand on Friday. A move below it triggered a flush, making it a critical resistance point now.
Actionable Setup: A strong rejection from this level would be a high-conviction short signal. Conversely, a firm reclaim and hold above this level would be the first sign that bulls are wrestling back control.
🔵 Key Support Zones (Where to Buy the Pullback)
While the posture is defensive, the primary trend is still up. These are the key structural levels where buyers are most likely to step in and defend the trend.
Initial Pullback Zone: 6450.00 – 6453.75
This is an interesting spot featuring a weekly level I found on the ETH chart at 6450.00, which aligns with the 4-hour level at 6453.75 from Thursday's failed breakdown.
Actionable Setup: I am not looking to buy this level outright. Instead, watch for a dip into 6450.00 followed by a swift reclaim of 6453.75. This "failed breakdown" setup could trigger a squeeze back toward the highs.
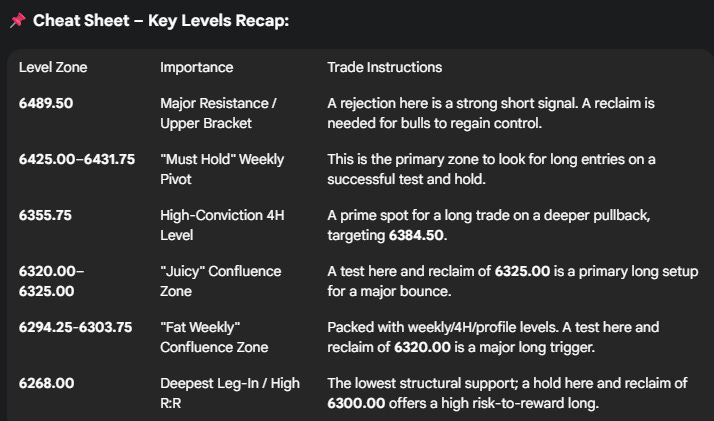
My Favorite Zone on the Map: 6425.00 – 6431.75
This is the most important zone for the week, hands down. It's a massive confluence area, containing a key daily level (6431.75), the previous week's high, and a 4-hour structural point (6425.00). I have this marked as "must hold or bad below."
Actionable Setup: This is the primary area to look for high-probability long entries. A successful test and hold of this zone, particularly around 6425.00, is a strong signal to buy into the trend.
The Leg-End Confluence: 6400.75 – 6407.25
If 6425.00 fails, this is the next major battleground. It contains the 4-hour leg-end at 6402.00, a 1-hour at 6400.75, and the critical daily "above/below" level at 6407.25.
Actionable Setup: A dip that tests the 6402.00 area followed by a strong reclaim of 6407.25 is a classic squeeze trigger setup.
The Monthly VWAP Confluence: 6384.50
This is a significant 4-hour level that aligns with the monthly VWAP—a key area watched by hedge funds and CTAs.
Actionable Setup: A test of 6384.50 followed by a reclaim of 6387.50 (the nearby low) could trigger a nice squeeze. This is a solid scalp zone, though not a primary swing long for me.
The High-Conviction 4-Hour Leg: 6355.75
This is a "great four-hour" level that I really like. For the intermediate leg sequence to remain valid, this is a key spot for buyers to appear.
Actionable Setup: This is a high-probability trade for me. I will be looking to get long here, with an initial profit target around the 6384.50 area.
The Prior ATH Leg Pivot: 6344.75 - 6348.00
This zone represents the daily leg that created the prior all-time high. As such, it's a critical area to monitor for a significant shift in momentum.
Actionable Setup: This is less of an entry zone and more of a major pivot. A strong bounce from here keeps the bullish structure intact. A failure to hold this zone would signal a deeper, more serious correction is likely underway, targeting the 6320.00s.
"Juicy" Confluence Zone: 6320.00 – 6325.00
This is a "juicy spot" packed with confluence. We have an untested 4-hour at 6320.00, the major daily momentum levels at 6320.00/6323.00, and the previous weekly value area low.
Actionable Setup: A test of the 6320.00 4-hour level followed by a reclaim of 6325.00 could trigger a massive squeeze higher.
The Deepest Leg-In: 6268.00
This is the leg-in on both the weekly and daily timeframes and represents the deepest structural support. The 50-day moving average is also creeping up toward this area, adding confluence.
Actionable Setup: While a trade this low carries risk, it offers the best risk-to-reward. The trigger for a major swing long would be a test of this level followed by a reclaim of the 6300.00 - 6302.00 area.

🧠 Final Thoughts:
The bulls have been put on notice. Friday's price action suggests sellers are becoming more aggressive at these highs, and the path of least resistance appears to be lower to test the well-defined support structures we've laid out. This week, the plan is to see how the market reacts at our 6425.00 pivot. A strong defense keeps the bull trend alive, while a failure opens the door for a much larger correction. Stay focused, manage your risk, and let's trade the plan.
Be careful, trade safe, and I'll see you for the morning outlooks.
Until next time—trade smart, stay prepared, and together we will conquer these markets!
Ryan Bailey, VICI Trading Solutions.

