
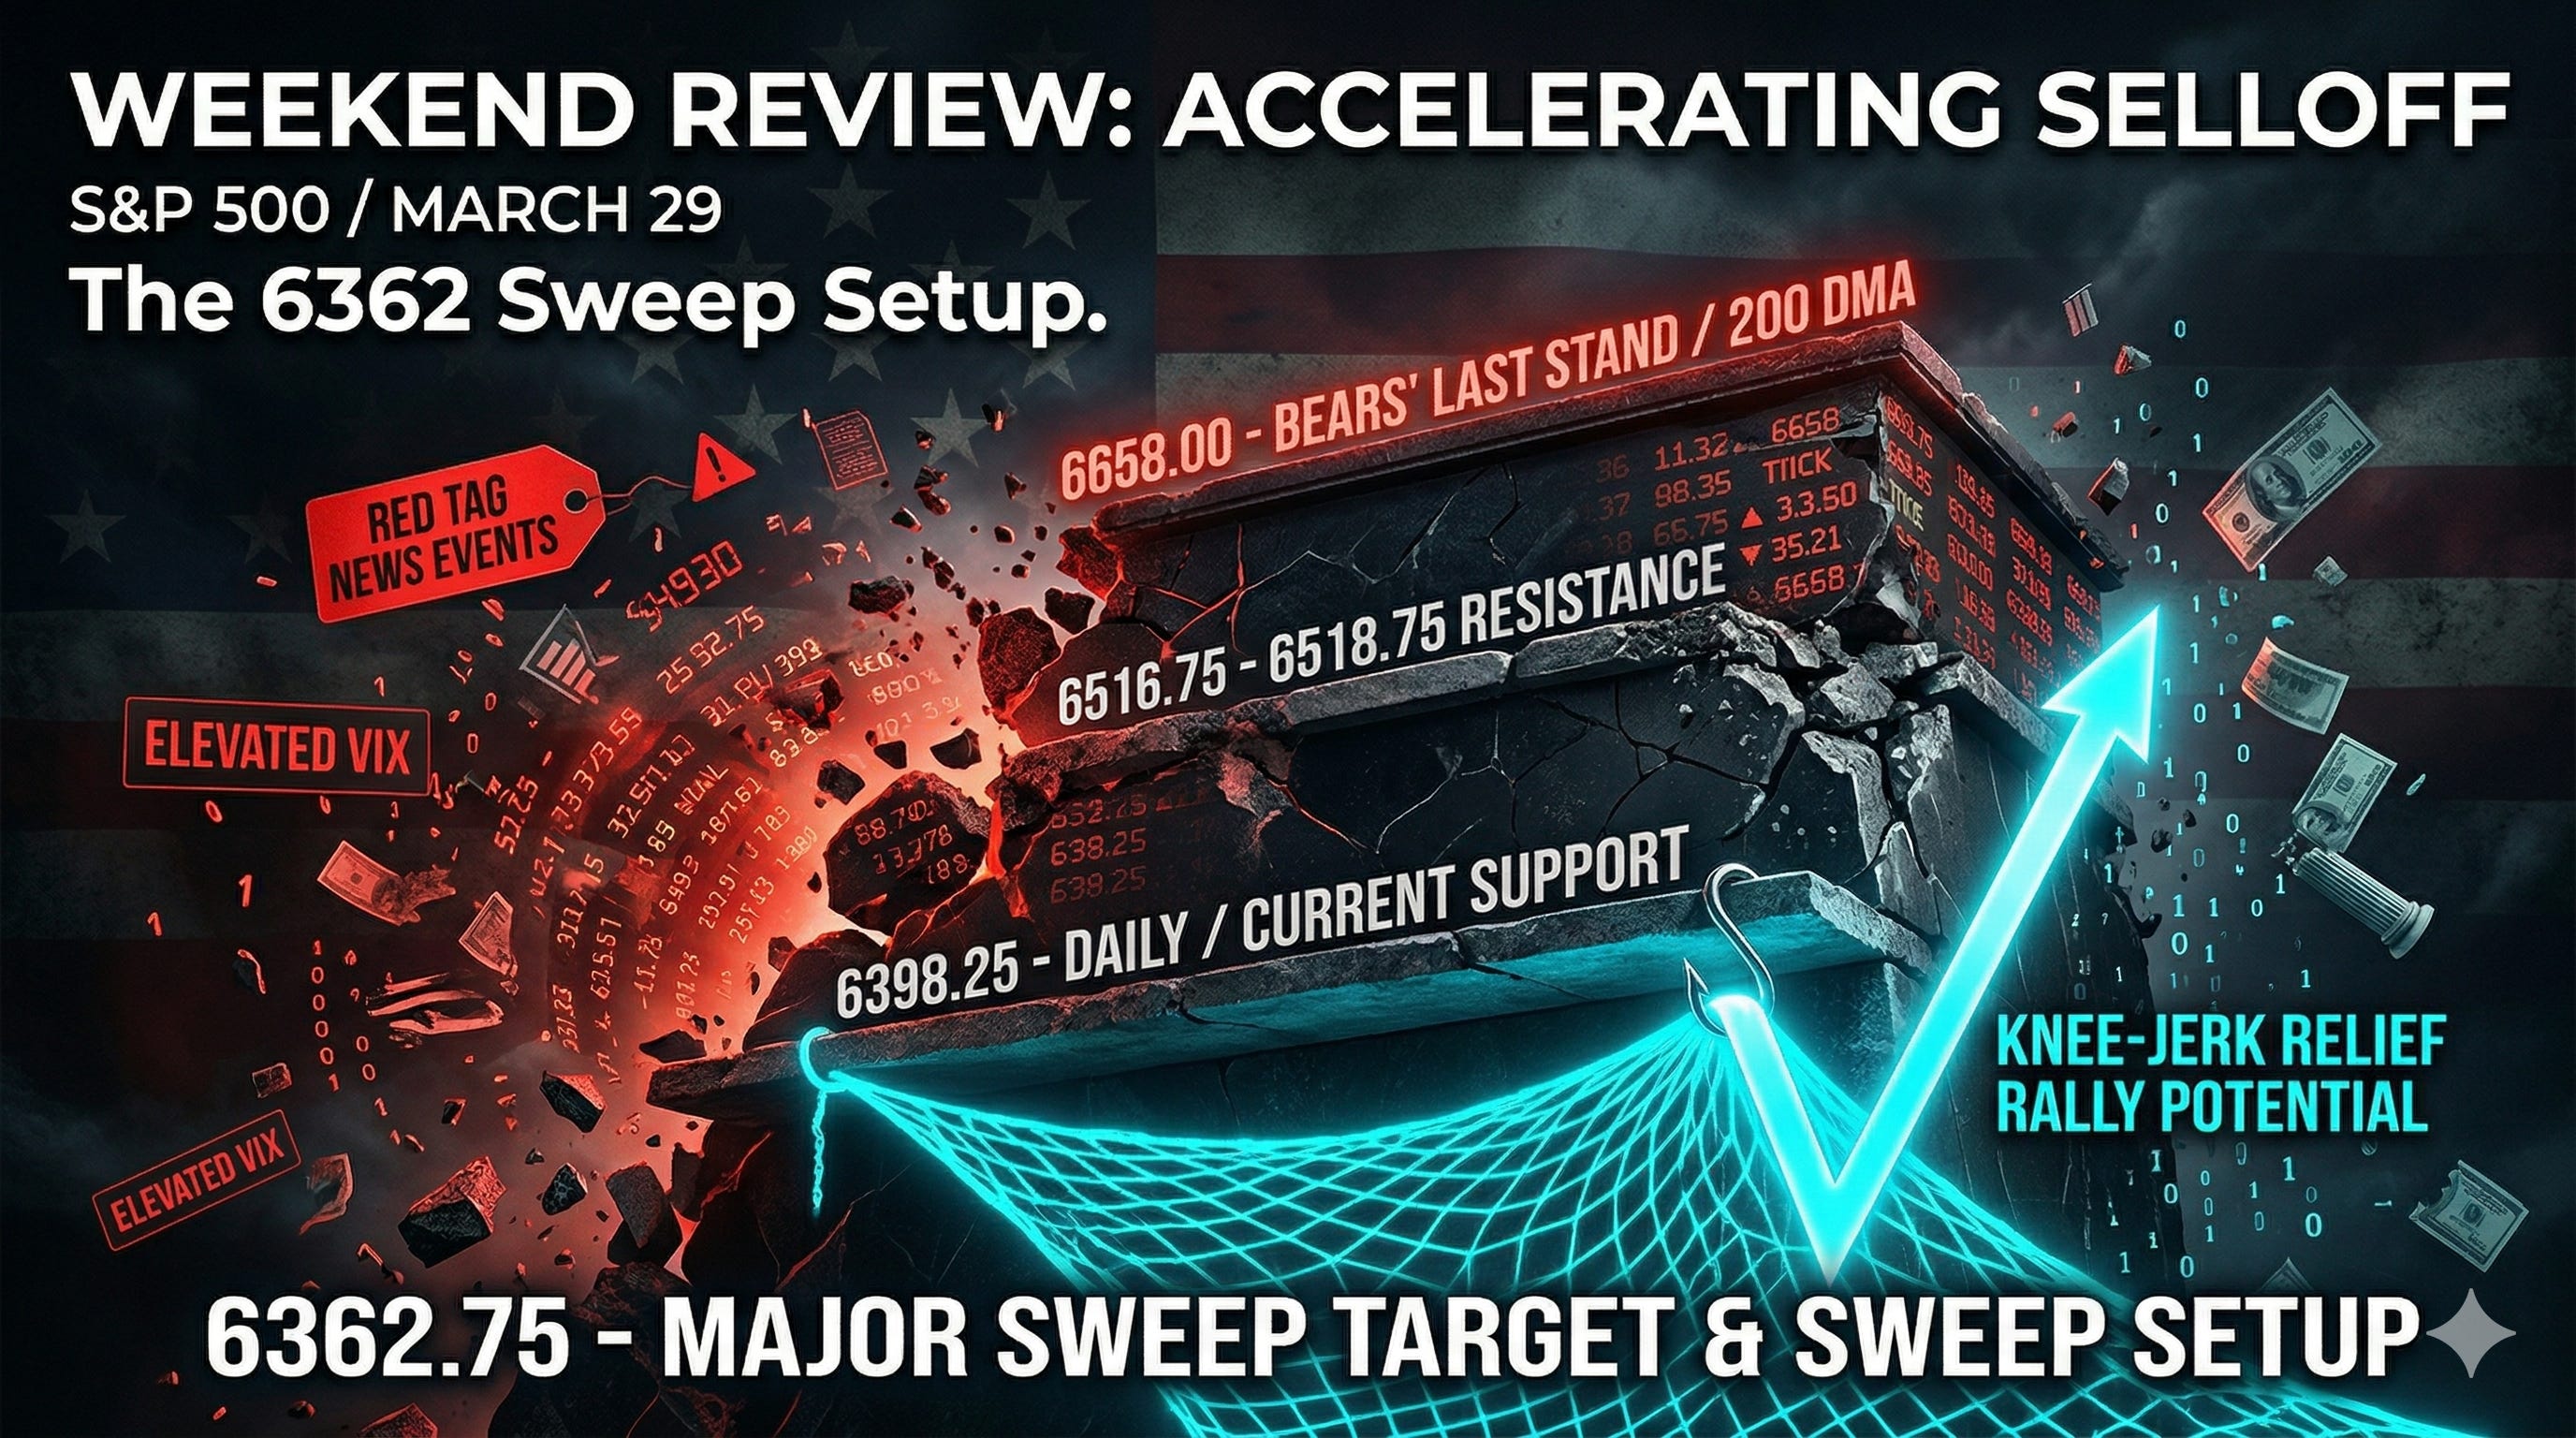
S&P 500 Weekend Review: Accelerating Selloff & The 6362 Sweep Setup
A detailed ES trade plan for the week of March 30th, breaking down the 6398.25 daily support, the 6362.75 leg low sweep, and the 6516.75 first line of resistance.

A note to subscribers: This week’s review comes in text format rather than the usual video version, as I am wrapping up the last day of vacation. Everything will be back to normal next week — consider today’s format an outlier and an exception, not a standard. With that said, we are going to stick strictly with the ES charts today as we examine the current candlestick price action and what the chart is currently telling us. Let’s get into it.
Hello everybody, and happy Sunday. It is March 29th, and welcome to the Week in Review. Last week, we came off an incredible week in the trade plans as we have essentially called every twist, turn, and pivot as we have been led down in this downtrend for weeks now, correctly pointing in the right direction and capturing every move. Congratulations to those who have taken advantage of all the opportunities I have laid out for you — careers were made in this down move, and we had a lot of subscribers who made a lot of money. We appreciate the direct messages and five-star reviews on Trust Pilot as you guys continue to stack chips with these well-thought-out trade plans.
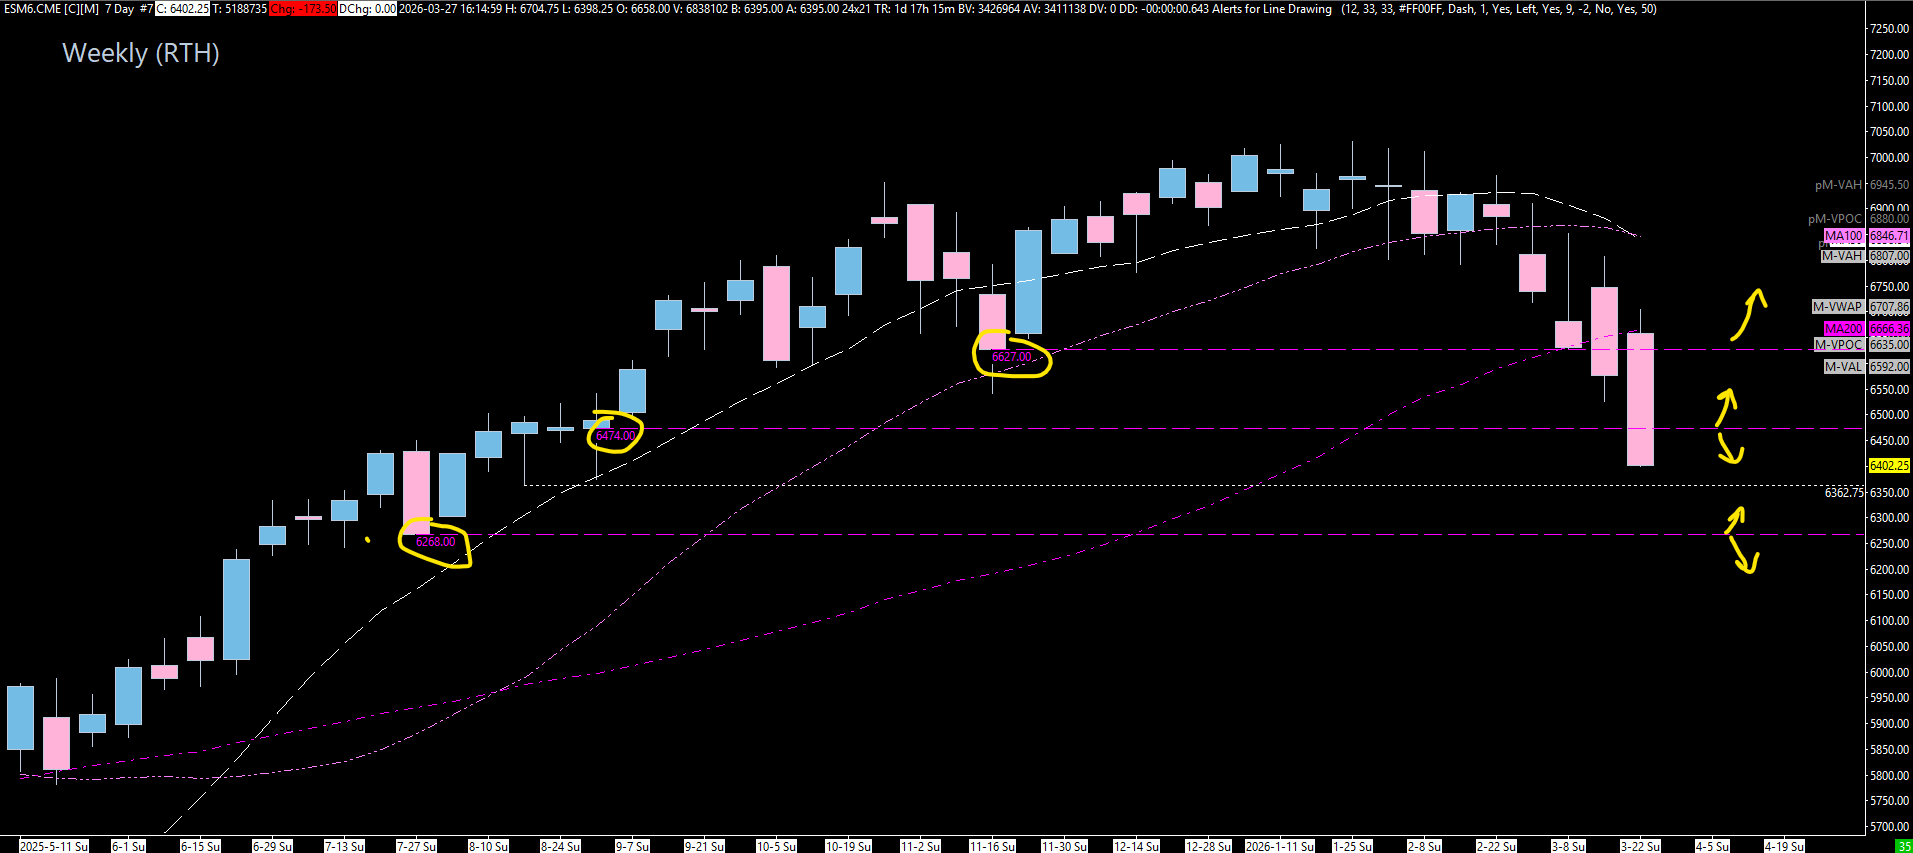
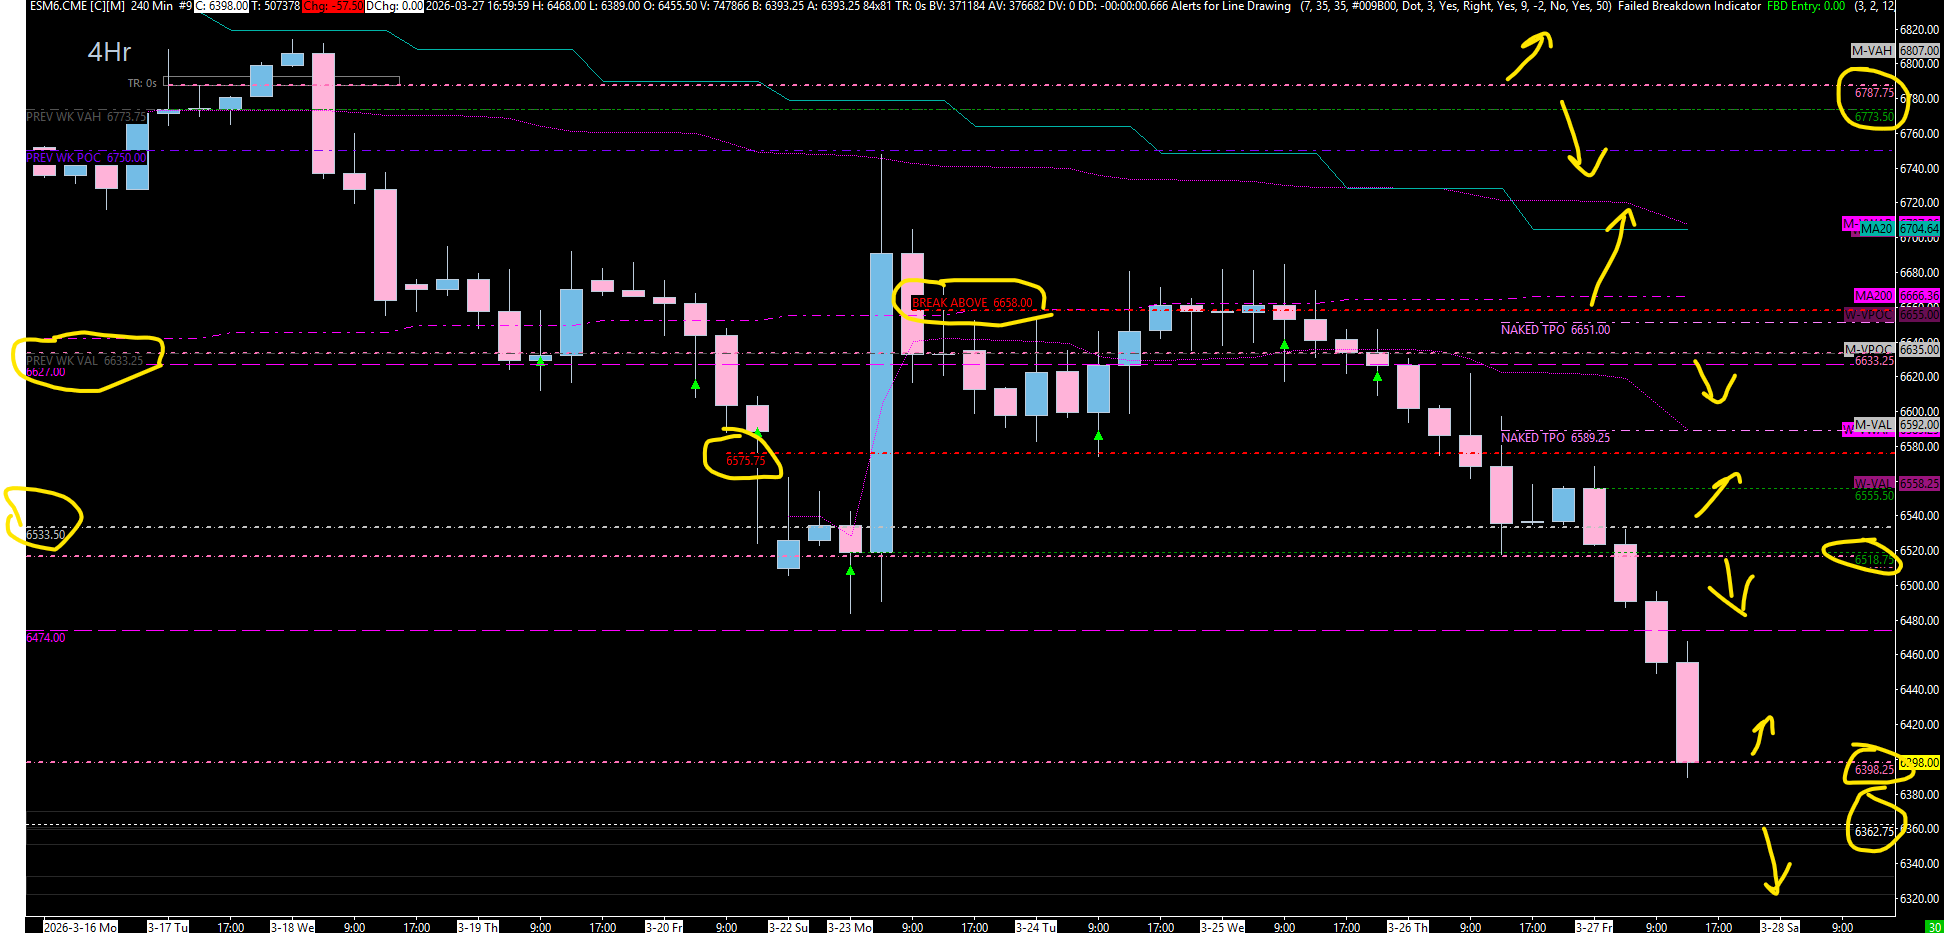
Looking at the charts now for ES, we had a massive selloff on Friday as price broke beneath our massive Daily structure at 6516.75. This was a big push that sent us all the way down into our leg end, essentially closing on Friday at our massive Daily at 6398.25. We sat here on Friday and closed directly above it, which leads me to believe that we may actually hold this support for now and pop above. However, this is a very important level for us to be above or below — we actually closed below the weekly support on the weekly time frame, leading me to believe that we can come lower than 6362.75. This would be a massive sweep of the Daily and Weekly leg that has taken us to the previous all-time highs, and we would look for a potential sweep underneath 6362.75 for potential relief, which could squeeze us a tad bit higher back into our untested resistance areas.
A Note on This Week’s Market:
News: Large number of different Red Tag news events coming this week. Stay prepared and be aware of the scheduled releases, as each one has the potential to create significant intraday volatility in this elevated environment.
Volume: Expect heightened participation as the selloff accelerates. Institutional repositioning and risk-off flows are dominating the tape across all indices, crypto, and some metals.
Range: Ranges have been massive and are expanding as the speed of the downside move increases. Given the magnitude of Friday’s selloff, expect another large-range week with significant moves in both directions.
Gamma: We are still in Negative Gamma territory. Dealers are hedging to the downside well below 6900. This means we will continue to have downside pressure applied and money will be made in both directions. Squeezes can be imminent and violent.
Trend: Severe downside lean. We have not gained on the Daily, Weekly, or 4-Hour time frames. The speed of the downside has increased significantly. We have a broad market selloff across all indices and risk assets, including crypto and some metals. All things point to risk-off territory. However, we have a lot of oversold indicators screaming at us right now, and at some point in time we will get a knee-jerk reaction.
🧠 Current Market Context
The Accelerating Selloff & Oversold Conditions
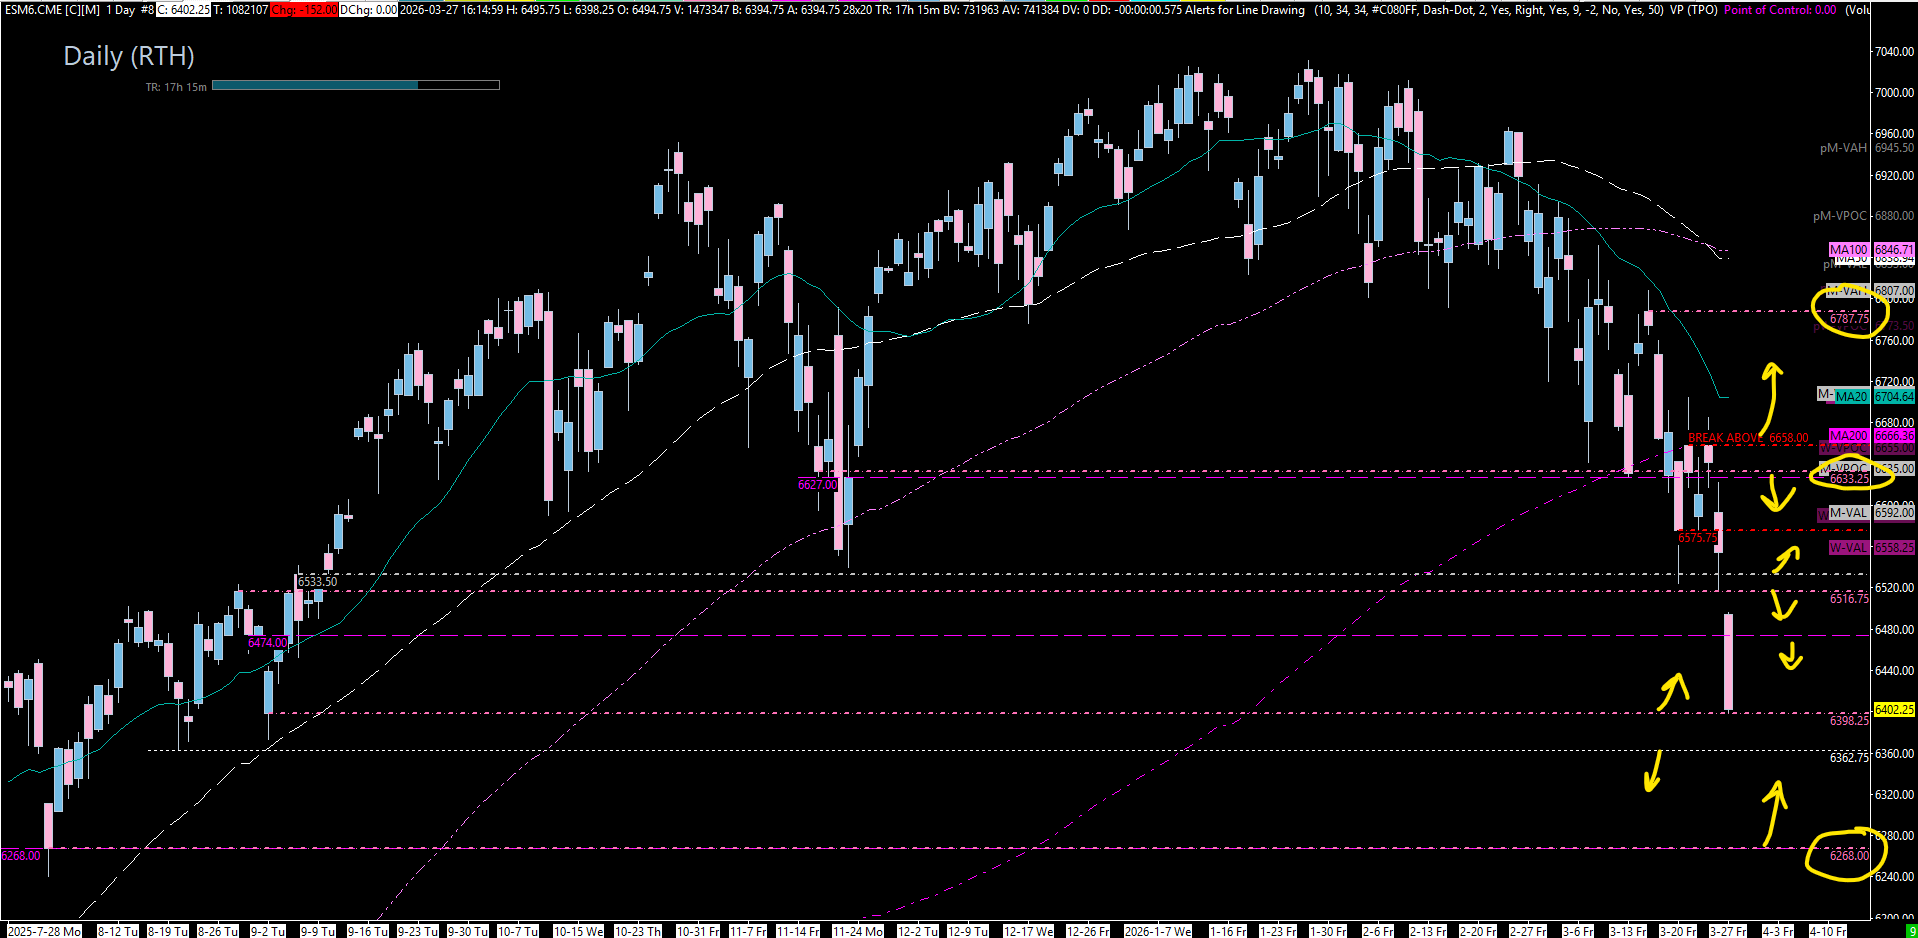
We are continuing to move down as planned from weeks ago, and the speed has increased. Friday’s massive selloff broke us beneath our critical Daily structure at 6516.75 and pushed us all the way down to the leg end at 6398.25. This is where we closed on Friday — directly above this massive Daily level. I do believe this area has an opportunity to provide us a pop, but the bigger picture remains firmly bearish.
The structure is clear: as long as we have daily closes below 6658.00, momentum continues to have a massive shift to the downside. Our big major area for us to get above first is 6533.50, as momentum will shift slightly back in the favor of the Bulls. The big above/below line will be the Untested Weekly at 6627.00 — look for this area to be highly reactionary and highly confluent. A push above that could take us much higher, and as long as we remain below it, we remain suppressed. Above 6658.00, the Bears start to lose control entirely as that is our tested Daily at the 200-day moving average.
At some point in time, we are going to find support — I would say it would either be here at 6398.25, or at a sweep of the lows to 6362.75, or worst case all the way down at the Untested Weekly/Daily at 6268.00. Somewhere in this area, we will get a pop back into the overhead untested resistance areas. This is not a time to be afraid, but more of a time to prepare and prepare yourself for long-term positioning. I do not believe the bleeding will stop quite yet, however, I also do not think we will continue to come down in a straight line. It will be important for us to understand the areas of support so that we can play the progression as we continue to follow this trend to the downside.
🚨 VIX & Volatility Context
VIX remains elevated as we sit firmly in a risk-off environment across the broad market. We are still in Negative Gamma territory with an increased rate of speed to the downside and an increased VIX of over 31— all things point to continued suppression on the indices. This is going to be a very tricky week as we come into a large number of different Red Tag news events, Negative Gamma, and an accelerating selloff. Keep a very close eye on VIX for any signs of exhaustion or reversal, as that will be one of the first signals of a potential knee-jerk reaction in the indices.
🎯 Detailed Actionable Trade Plan (ES Futures)
We are directly above our Daily at 6398.25 after Friday’s massive selloff. The lean is firmly to the downside. Below us, the 6362.75 Weekly leg low is the massive sweep target — a sweep and reclaim here could trigger a significant short squeeze. Above us, the first real line of resistance is the 6516.75 Daily and the 6518.75 4-Hour. As long as daily closes remain below 6658.00, we will continue to have massive downside pressure.
🔴 Key Resistance Zones & Setups
The Untested Weekly Momentum Shift: 6474.00
6474.00 (Untested Weekly).
Context: This is our first major untested resistance level directly above us on the weekly time frame. This is a massive area that would create a large momentum shift if we push above or below this spot. If price pops off support below, this will be the first meaningful hurdle.
Actionable Setup: Look for resistance here on first touch. Acceptance back above 6474.00 could take us into the double Daily zone above.
The First Real Line of Resistance: 6516.75 - 6518.75
6518.75 (Untested 4-Hour), 6516.75 (Untested Daily).
Context: This is the first real line where I would be looking for resistance, and the most important level for the overhead structure. Friday’s selloff broke us beneath this massive Daily structure, and it is now untested resistance from the bottom up. The Untested 4-Hour at 6518.75 lines up perfectly. As long as price remains below 6516.75, we will continue to have a massive push to the downside.
Actionable Setup: Short Setup: If price pushes up into this zone, look for a reaction. These Dailies are now untested from the bottom up and will more than likely provide a lot of resistance on first touch. If price is unable to get back above 6516.75, we could get an immediate reaction bringing us down much, much further into our untested support.
The Slight Bull Shift Zone: 6533.50
6533.50 (Untested Daily).
Context: This is our big major area for us to get above first. If price accepts back above 6533.50, we could get a nice push to the upside giving us a slight amount of relief. Momentum shifts slightly back in the favor of the Bulls above this level. However, I do truly feel that above 6533.50 they could continue to push higher.
Actionable Setup: If price pushes through 6516.75 and accepts above 6533.50, look for a continuation push into the 6575.75 midpoint pivot. This is the trigger for a more sustained relief rally.
The Midpoint Pivot: 6575.75
6575.75 (Daily / Midpoint Pivot).
Context: This is our midpoint pivot located directly in between 6533.50 and the massive Untested Weekly at 6627.00. A break above or below 6575.75 will be a further momentum shift for the Bulls and could take us into the highly confluent weekly zone above.
Actionable Setup: Use this as your gauge for continuation. Above 6575.75 opens the door to the Untested Weekly at 6627.00. Below it, we remain in the lower half of the resistance structure.
The Massive Untested Weekly/Daily Wall: 6627.00 - 6633.25
6633.25 (Untested Daily / Previous Weekly Value Area Low), 6627.00 (Untested Weekly).
Context: This is the big above/below line. The Untested Weekly at 6627.00 is highly reactionary and highly confluent — we have talked about the significance of this level multiple times. The Untested Daily at 6633.25 sits directly above it and is also the Previous Weekly Value Area Low. A push above 6633.25 would mean we have pushed above the PWAL and accepted value back inside the previous weeks’ value area, which shifts momentum considerably in favor of the Bulls. As long as we remain below 6627.00, we remain suppressed.
Actionable Setup: Short Setup: Look for a massive reaction here on first touch at 6627.00. If price pushes above and accepts back above 6633.25, we could push into the tested Daily at 6658.00. If price rejects, we could see a swift move back toward the downside.
The Bears’ Last Stand — 200 DMA Reclaim: 6658.00
6658.00 (Tested Daily / 200 DMA / Furthest Upside Pivot).
Context: This is our furthest upside pivot. The Bears start to lose control and momentum shifts back in the favor of the Bulls if they get back above 6658.00. At this level, they have essentially reclaimed the 200-day moving average and pushed above the Previous Weekly Value Area Low. Doing all this would shift momentum considerably and allow them to push freely all the way up into the highest untested areas.
Actionable Setup: If price pushes above 6658.00, the Bears lose control entirely and we could push all the way up into 6773.50 and 6787.75 — the highest untested levels on the map.
Warning: As long as we remain suppressed below 6658.00, we will continue to have the massive downside pressure on the indices. This is the line in the sand for the Bears.
The Highest Untested — Prime Short Zone: 6773.50 - 6787.75
6787.75 (Untested Daily), 6773.50 (Untested 4-Hour).
Context: This is a highly concentrated and highly reactionary area that I would be looking for a massive smack at. These are the highest untested levels on the entire map — if price somehow pushes all the way up here, I would expect a significant reaction.
Actionable Setup: Short Setup: Look for this area to play and get back below 6750.00 for a potential move down. This is the prime short location if the market squeezes all the way up here.
🔵 Key Support Zones & Setups
The Daily Support — Current Location: 6398.25
6398.25 (Daily).
Context: This is where we closed on Friday — directly above this massive Daily level. This is a big Daily that, in my opinion, has an opportunity to provide us a pop. We sat here on Friday and closed directly above it, which leads me to believe that we may hold this support for now and bounce. However, this is a very important level to be above or below.
Actionable Setup: If we continue to hold this area and pop back up, look for a push into the Untested Weekly at 6474.00 as the first resistance target. If price pushes below 6398.25, we are heading straight for the sweep of the leg lows below.
The Massive Sweep Target: 6362.75
6362.75 (Weekly Leg Low).
Context: This is the biggest level we have in terms of a downside move. We closed below the weekly support on the weekly time frame, leading me to believe that we can come lower than 6362.75. This would be a massive sweep of the Daily and Weekly leg that has taken us to the previous all-time highs. A sweep underneath 6362.75 could provide potential relief, which could squeeze us a tad bit higher back into our untested resistance areas.
Actionable Setup: Sweep Setup: Look for a sweep below 6362.75 for potential relief. A reclaim back above this level could trigger a significant short squeeze back into the untested resistance overhead. This is the kind of level where careers are made — be patient, wait for the sweep, and look for the reclaim.
Warning: If price pushes below 6362.75 and does not reclaim, we are heading straight into the Untested Weekly/Daily at 6268.00. Do not assume the sweep will hold — let it prove itself first.
The Prime Support — Untested Weekly/Daily: 6268.00
6268.00 (Untested Weekly / Untested Daily).
Context: Directly below the sweep target, this is a prime candidate for support. This is an Untested Weekly and Untested Daily confluence that I do not see making it through on the first touch. I do believe this area would play and play quite well, potentially popping our price up a couple hundred points. This is our relief valve if the 6362.75 sweep does not hold.
Actionable Setup: Buy Setup: If we lose 6362.75 and push below, look for 6268.00 to provide a massive pushback to the upside. This level should give us a significant first-touch reaction and could trigger a squeeze back into the overhead resistance areas.
Warning: If 6268.00 doesn’t hold, in my opinion the only way they get through this is by Globex gapping below this area of support. If that happens, we could push much lower — it is over 150 points to my next untested area of support. Be very careful on the downside beneath this level.
The Deep Untested — Last Line of Defense: 5978.25 - 6093.00
6093.00 (First Untested Area Below 6268), 5978.25 (Lower Support).
Context: If price somehow gaps below 6268.00, this is the next area of support. It is over 150 points lower, making it the deep last-resort zone. There is support between 5978.25 and 6093.00 where price would most certainly find an area to react and pop back from.
Actionable Setup: This is the worst-case scenario zone. If we reach here, look for a reaction and a bounce. The distance from 6268.00 to this zone is massive, so use extreme caution and tighter position sizing if we are anywhere near these levels.
📌 Cheat Sheet – Key Levels Recap
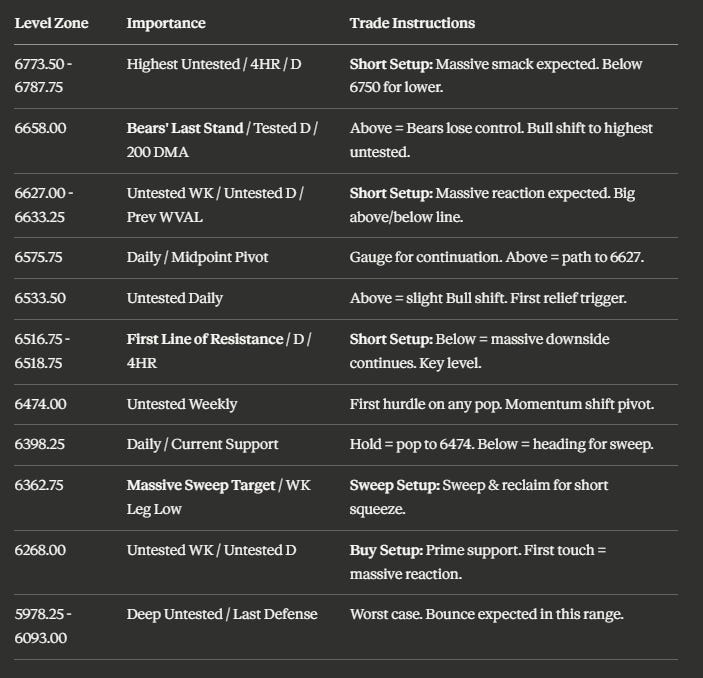
🧠 Final Thoughts
We are continuing to move down as planned from weeks ago, and the speed has increased significantly. We have a lot of oversold indicators screaming at us right now, and at some point in time we will get a knee-jerk reaction. I would say it would either be at the support here at 6398.25, or at a sweep of the lows to 6362.75, or worst case all the way down at the Untested Weekly/Daily at 6268.00. Somewhere in this area, we are going to find support, and we will get a pop back into the overhead untested resistance.
Keep in mind that as long as we have daily closes below 6658.00, momentum continues to have a massive shift to the downside. Our first major area for us to get above is 6533.50, where things shift slightly bullish. The big above/below line is the 6627.00 Untested Weekly — look for this area to be highly reactionary and highly confluent. A push above 6658.00 is where the Bears completely lose control and could push us freely all the way into the highest untested at 6787.75. As long as we remain below 6516.75, we will continue to have massive downside pressure.
This is going to be a very tricky week as we come into a large number of Red Tag news events, Negative Gamma territory, an increased rate of speed to the downside, and an elevated VIX. All things point to risk-off territory with a broad market selloff across all indices and risk assets. This is not a time to be afraid, but more of a time to prepare — I do not believe the bleeding will stop quite yet, but I also do not think we will continue down in a straight line. Understand your areas of support so that you can play the progression as we follow this trend. Stick to the plan, be patient, and a trade will present itself.
Until next time—trade smart, stay prepared, and together we will conquer these markets!
Ryan Bailey, VICI Trading Solutions.
📊 TradingView Indicator String
Copy and paste the levels below into your S&P Edge Levels indicator to automatically plot today’s key levels on your chart:
6787.75|D|D
6773.50|4HR|4H
6658.00|Tested D|TD
6633.25|D|D
6633.25|P.W. VAL|GD
6627.00|WK|W
6575.75|D|D
6533.50|D|D
6518.75|4HR|4H
6516.75|D|D
6474.00|WK|W
6398.25|D|D
6268.00|WK|W
ES RTH WEEKLY
ES RTH DAILY
ES 4HR OVERLAY
The market is moving fast and staying below key resistance, so patience and planning around support levels is the smart move this week