

Please don't forget to leave your feedback, LIKE, and SHARE this post!
This is how I know I'm putting out quality content for you.
What's up, everybody? It is Sunday, and as we approach the market open, it's time to figure out what levels we're going to play. The S&P is on an absolute tear, and for those of you who trade the real index, I suggest you check out the SPX video I put out yesterday, as it will correlate to this plan.
Before we get into the charts, I want to emphasize a monumental development that I posted about recently: on August 18th, we got a 100-day over 200-day moving average "Golden Cross." This is a big deal. This rare signal has only happened 15 times in the last 45 years and historically suggests a one-year gain of at least 15% and a two-year gain of around 30%. This is a powerful, long-term signal for more upside.
Now, let's get into the levels.
🧠 Current Market Context
This thing is on a moon mission. We are looking up, not because of a moving average, but because the charts confirm it. The weekly TPO shows we have been percolating sideways for the past month, building a massive amount of value and accepting this higher range. The market looks primed to break out to the upside.
While the higher timeframes (Daily, Weekly, 4-Hour) are all still pointing up, we did see a 100-point drop on Friday. This is not a loss of support; it's a healthy pullback. Our job is not to short this market, but to find the best possible location to join the trend.
🎯 Detailed Actionable Trade Plan
🔴 Key Resistance Zones & Upside Targets
While we have not lost support on any important timeframe, these untested daily levels above us could provide reactions. In my opinion, these are targets for longs, not primary shorting opportunities.
The Daily Pivot Zone: 6489.50 – 6496.75
This is a fat area of resistance from a previous leg down. We will use this as our daily "quote unquote" pivot. Acceptance above this is needed for a sustained move higher.
Next Resistance: 6516.75
This is an untested daily level from the leg down on August 28th.
Highest Resistance: 6533.50
This is the daily leg from the all-time high that we sold off from on Friday.
🔵 Key Support Zones & Setups
The "I Like This A Lot" FBD Zone: 6440.00 – 6446.75
We have a daily level at 6446.75 that I was eyeing last week, and it's still there and untested. I really like the significant 4-hour leg up at 6440.00 as well.
Actionable Setup: A test into this zone that finds a hold offers a great failed breakdown opportunity. The trigger would be a reclaim of 6450.75 (Friday's low), which could squeeze us back up into the resistance zones. I like this setup a lot.
The HTF Line in the Sand: 6425.00 – 6431.75
This zone is home to our monster weekly pivot at 6425.00 and the important daily at 6431.75. This is our big high-timeframe line in the sand.
The "Juicy Spot" / Primary Buy Zone: 6413.25
This is the spot that I like the most. The 6413.25 daily leg is a prime level, and it corresponds to the beautiful 6400.00 level on the SPX chart. It's just a juicy spot.
Actionable Setup: I think 6413.25 can be played on first touch, but the huge, huge, huge confirmation is getting acceptance back above 6425.00 and especially 6431.75. A reclaim of those levels could squeeze us to all-time highs.
The Deeper, Cautious Zone: 6392.25 – 6398.25
We have a newer daily leg up at 6398.25, but it's not my choice level as it didn't close above a previous leg down. Just below it is a 4-hour at 6392.25.
Actionable Setup & Key Concern: While this area can play, I think you're going to have a big problem getting back over 6412.00/6413.00. I would be sketched out down here and would need to see acceptance back above 6413.00 before getting excited about a long.
The Ultimate Target / Main Leg-End: 6268.00
If we get a daily close below 6413.00, we will likely traverse down to the big weekly and daily leg-end at 6268.00.
Actionable Setup: This would be our ultimate target on a deeper correction. From a long here, the first major profit target would be the 6398.25 area, but I'd be taking a lot of profits around 6410.00.
🚨 Momentum Shift Levels
Primary Line in the Sand: The daily leg up at 6413.25. This is the key sub-leg. A daily close below this level puts the bulls in trouble.
The HTF Pivot: The weekly at 6425.00. This has been our monster pivot for weeks. Getting and staying above this is critical for bulls.
📌 Cheat Sheet – Key Levels Recap
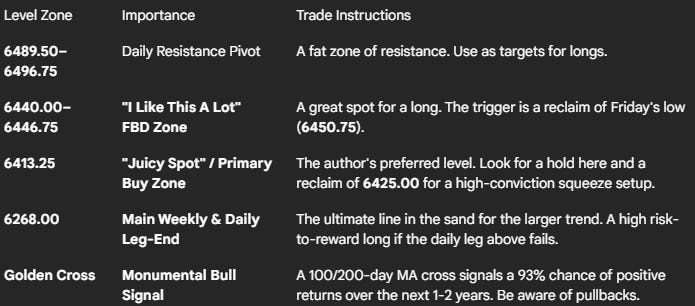
🧠 Final Thoughts
This is the big leg, guys, and we're still in it. There is no reason to be bearish. The long-term picture is monumentally bullish, and the short-term structure is still intact. The plan is simple: let it pull back, let it come to our levels, and look for the best opportunity to buy it. The "juicy spot" at 6413.25 is the main area of interest, but the 6440.00 zone also provides a fantastic setup. Let's get it.
Have a fantastic weekend, and I look forward to getting into the battle with you again next week.
Until next time—trade smart, stay prepared, and together we will conquer these markets!
Ryan Bailey,
VICI Trading Solutions.
