Good morning, everyone, and welcome to the weekend review. This one is for all of you SPX traders in the room.
As you’ve no doubt experienced, this market continues to move straight up. It’s unbelievable—nothing seems to be able to stop it, not even a government shutdown. In fact, the shutdown has ironically been great for the markets. First, it means no Red Tag News, so no bad news is good news. But more importantly, the Fed has now stated there is a 100% chance of a rate cut next month, and they’ve pretty much guaranteed another one before the end of the year. That’s two more rate cuts for a total of three this year, which is a massive tailwind for stocks.
🧠 Current Market Context
With all signs pointing up, the market is undeniably lofty. I would love a pullback, but I’m not sure I’m going to get one. Even if we do, we can come down quite a bit before the structure is even remotely bearish. The price action has been super grindy—long, painful days to make 10 points—which makes buying these highs difficult. The plan is not to chase, but to patiently wait for the market to come down to our high-confluence levels where we can buy the dip.
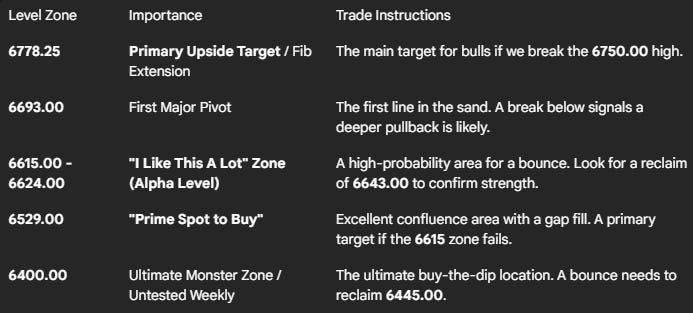
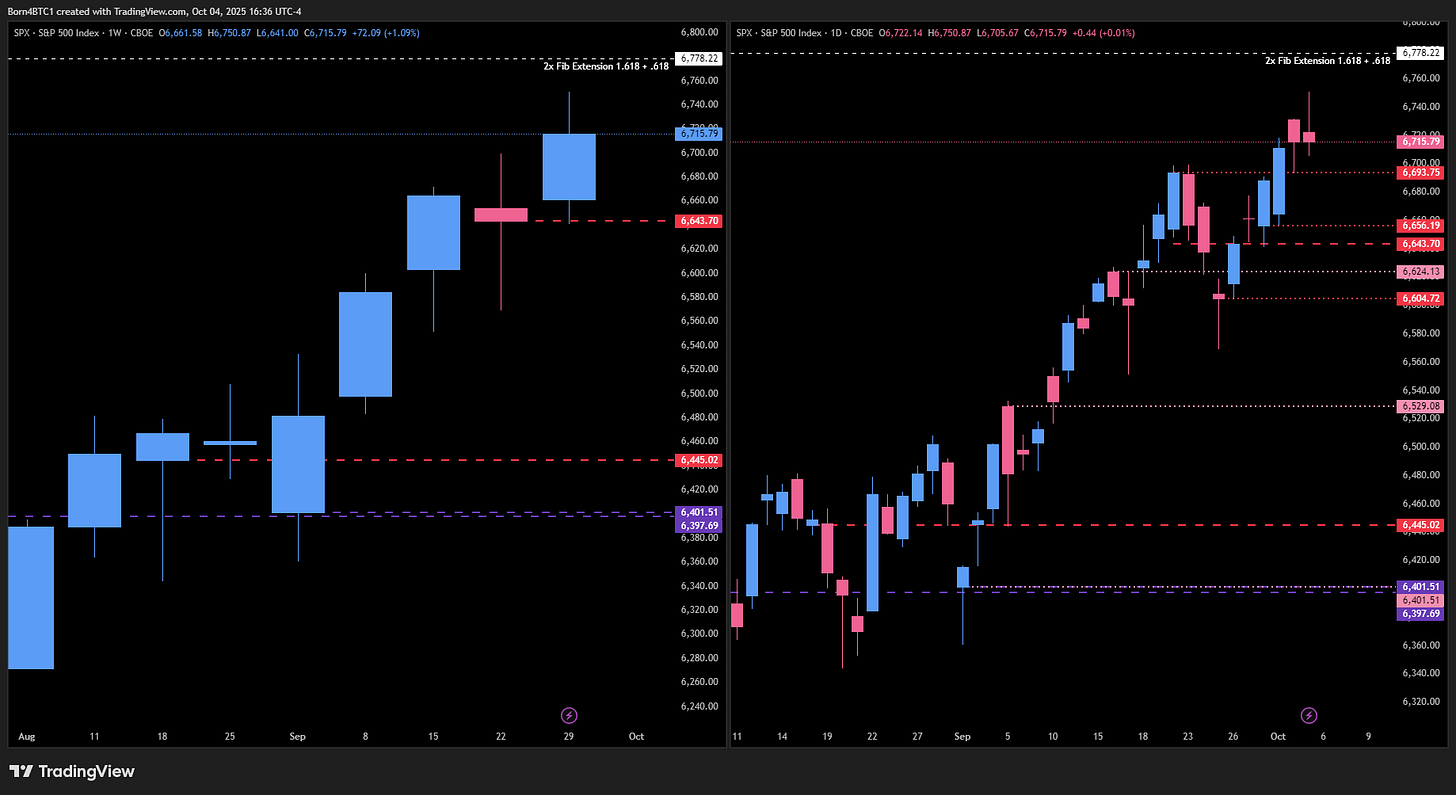
At these all-time highs, we have no structural resistance for context. I did some fib extensions and found a confluence of two different measurements pointing directly to 6778.25. If Friday’s high of 6750.00 doesn’t hold as a temporary top, that fib level is my primary upside target.
🎯 Detailed Actionable Trade Plan
🔴 Key Resistance & Profit-Taking Targets
The Fib Extension Target: 6778.25
This is my primary upside target. It’s a confluence of a 1.68 and a 6.18 fib extension, giving it a high degree of probability if we break above the 6750.00 high.
The Former Support Target: 6746.00
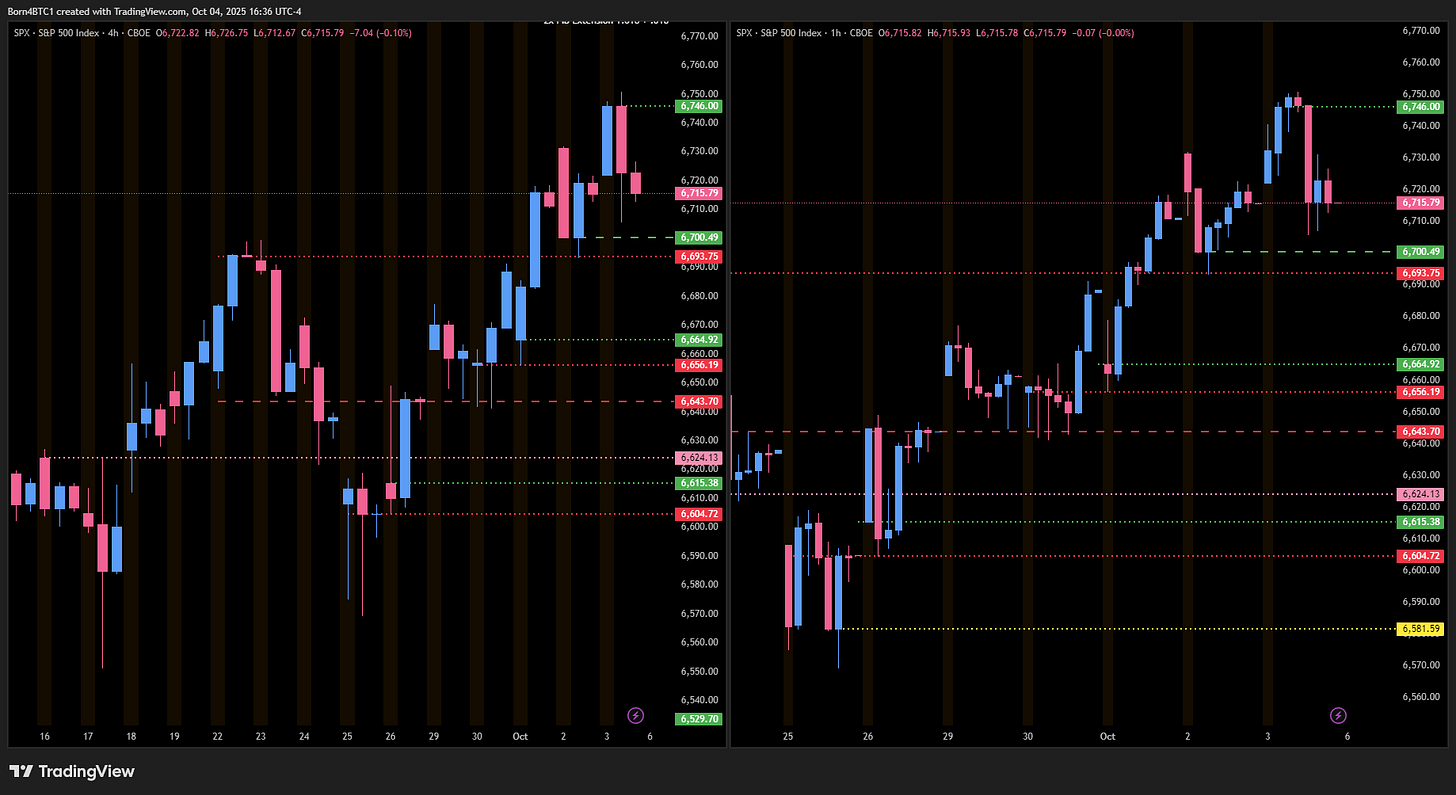
This is the 4-hour support from Friday’s high loss. Because the 4-hour trend has not been broken, this is simply a target on the way up. I would not be looking to short this, but there could be a reaction here as they let trapped buyers from the ES contract out of their positions.
🔵 Key Support Zones & Setups
The First Pivot Zone: 6693.00
This is a very significant daily pivot. A break below here is the first sign of weakness and opens the door to lower levels. As you know, this was a banger of a trade for us on Thursday, and it remains a key line in the sand.
The First Untested Bounce Zone: 6663.00 - 6665.00
This is a great spot, defined by an untested 4-hour leg up at 6664.92 (call it 6665.00) and a weekly level at 6663.00. This is a monster area with some nice confluence.
Actionable Setup: A bounce from here would be valid, but I would look for a push back up and a reclaim of the 6693.00 pivot to confirm buyers have regained control.
The “I Like This A Lot” Zone: 6615.00 - 6624.00
This is the leg for the current high, containing an untested daily at 6624.00 and a 4-hour level at 6615.00. We can easily come down here, hold, and go right back up. This is an absolute possibility.
Actionable Setup: A bounce from this zone is a high-probability trade. To get its mojo back, we would need to see price get back above the significant resistance pivots at 6643.00 and ultimately 6656.00.
The “Prime Spot to Buy”: 6529.00
If all else fails and we get a daily close under 6604.00, this is our next major target. This is a great, great location—a prime spot to buy. It’s a confluence of a nice 4-hour level, a gap fill, and a daily level.
The Ultimate Monster Zone: 6400.00
This is the big one. We have an untested daily and an untested weekly both sitting around 6400.00.
Actionable Setup: If we were to pull back this far, the key would be a bounce from 6400.00 followed by a reclaim of the monster weekly pivot at 6445.00.
📌 Cheat Sheet – Key Levels Recap
🧠 Final Thoughts
The macro picture is incredibly bullish, and fighting this trend is a losing game. The plan is to remain patient and wait for the market to give us a pullback into one of our well-defined, high-confluence support zones. Chasing grindy price action at all-time highs is low probability. We’ll let the market come to us and look to buy the dip at a great location.
Until next time—trade smart, stay prepared, and together we will conquer these markets!
Ryan Bailey, VICI Trading Solutions.
Weekly / Daily:
4hr/1hr:


