Welcome to the week in review for the SPX,
For those of you who trade the index directly, this one’s for you. The action on the SPX chart this past week provided critical clarity for the entire market. While the ES futures chart looked questionable due to rollover nonsense, the SPX chart held firm, confirming the bullish structure remains fully intact. This is why we defer to the true index in times of uncertainty.
🧠 Current Market Context
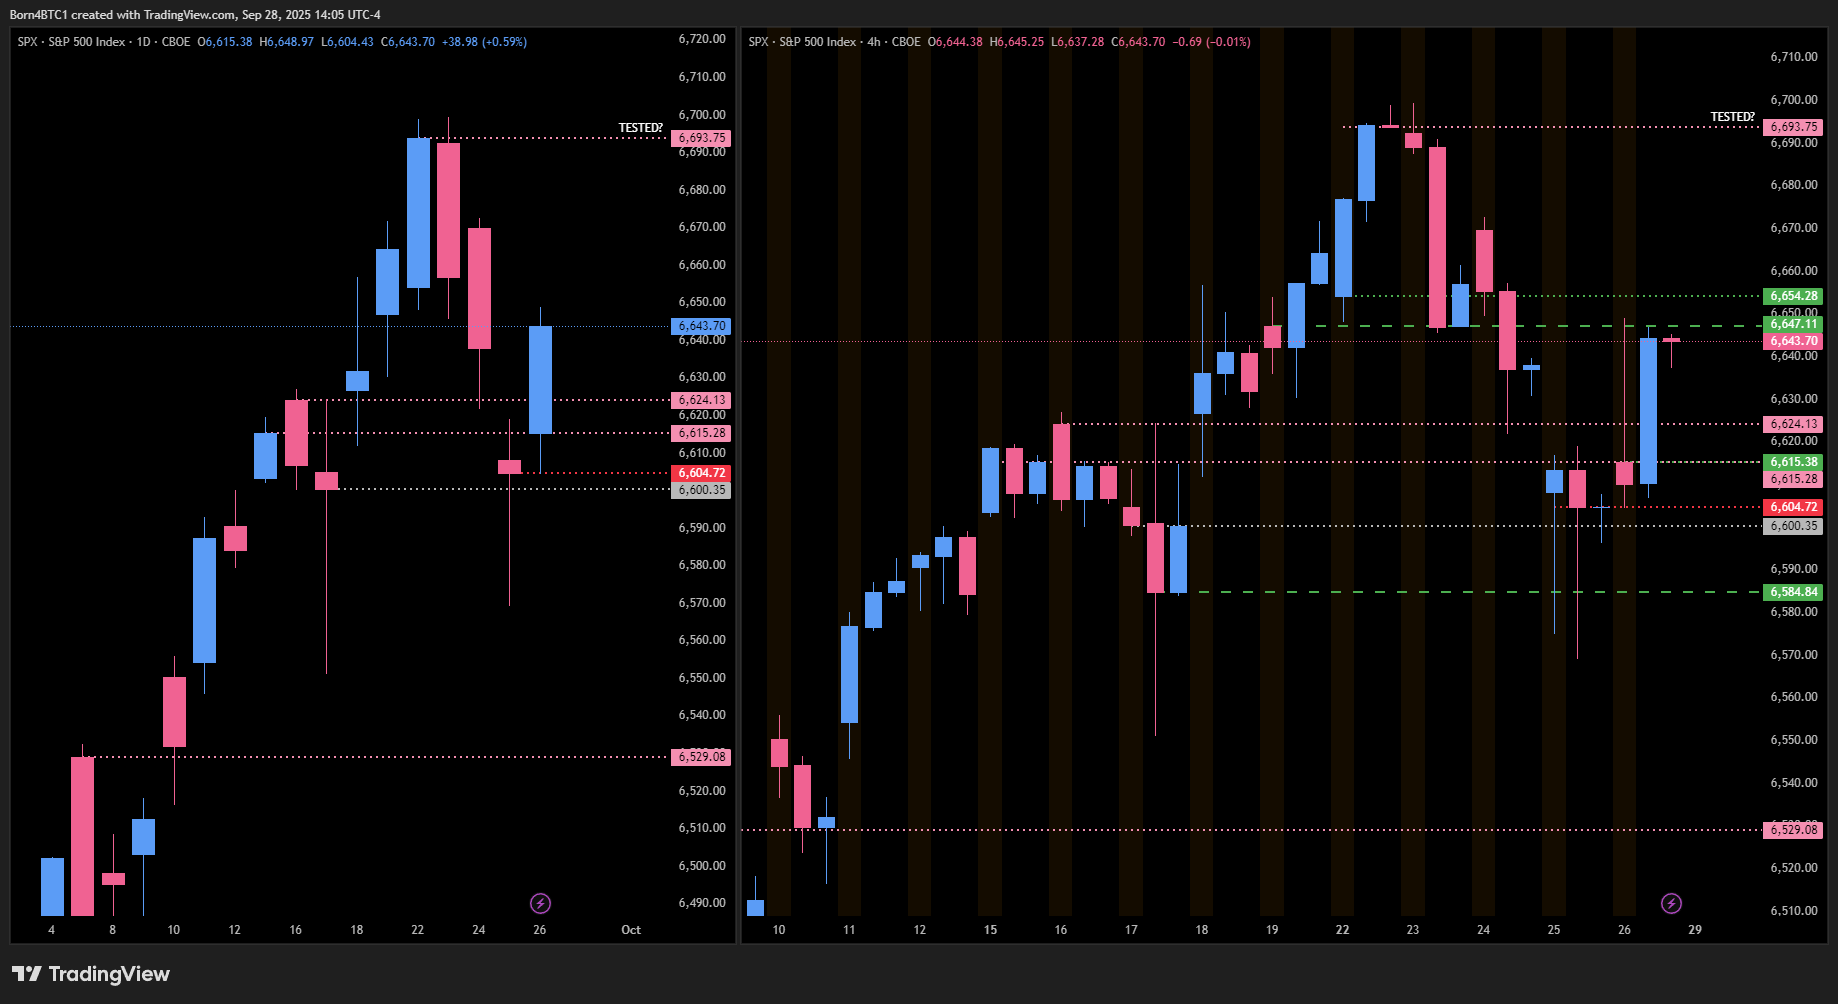
The story of the week was the successful defense of the key daily leg around 6600.00. While ES futures actually closed below its corresponding level, the SPX did not. It held, giving us the strength to continue pushing higher. On Friday, we saw a perfect, to-the-tick bounce off the 6604.72 daily level, which propelled us back through former resistance levels at 6615.00 and 6624.00.
Because the daily and 4-hour timeframes have not broken their bullish structure, my bias remains to the upside. The game plan is simple: we are looking for levels to buy on a pullback. It looks pretty good to me for more “up,” and we’ll continue playing that game until the market proves us wrong.
🚨 VIX Analysis
The VIX is giving us the same signals we saw on the ES plan, which reinforces our market-wide thesis. The big pivot at 16.36 finally gave up on Friday after being tested three times, providing a huge tailwind for the rally into the close.
Now, we’re approaching a critical support zone that has been important for weeks.
The area to watch is the untested daily level at 14.93 and the significant weekly level just below it at 14.85. I anticipate we could see a slight reaction or a pop from this zone, which would cause a temporary pullback in the SPX.
As long as we stay below 16.36, the market is free to chop and grind higher.
The massive tailwind scenario: A definitive break and hold below 14.85 would give the bulls full control and could fuel a very strong continuation higher in the SPX.
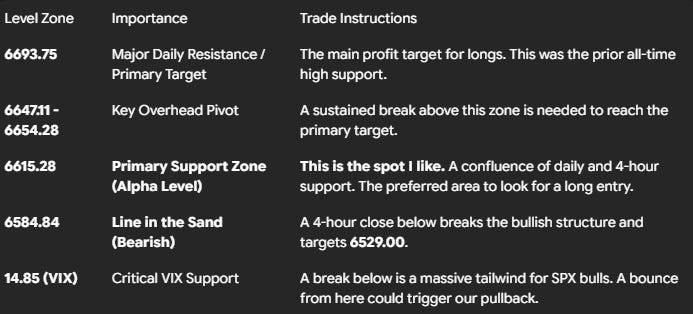
🎯 Detailed Actionable Trade Plan
🔴 Key Resistance Zones & Setups
The First Test / Pivot Zone: 6647.11 - 6654.28
This area contains the 4-hour pivot at 6647.11 and the first key untested 4-hour resistance at 6654.28. We need to get and stay above here to continue the move higher.
Actionable Setup: A sustained break and hold above 6654.28 is the trigger that opens the door to our main daily target.
The Main Event: 6693.75
This is our major untested daily resistance and the primary target for any long positions from below. This level is significant as it represents the all-time high support that was lost during the last sell-off. There is also an untested 1-hour level just above this that would be a fantastic spot to take profits.
Actionable Setup: This is a profit-taking target. A push above 6654.28 should get us there.
🔵 Key Support Zones & Setups
The A+ Confluence Zone: 6615.28
Now that I see this on the chart, this is the one I really like. We have a daily level and a brand new 4-hour level right on top of each other at 6615.28. This confluence makes it a high-conviction area for me. The significant daily at 6624.00 sits just above it. This whole 6615.00 - 6624.00 area is where we should find buyers.
Actionable Setup: I am looking to buy a pullback into this zone. A bounce from 6615.28 that gets acceptance back above 6624.00 would be a very strong signal for a move toward the 6693.75 target.
The Bearish Line in the Sand: 6584.84
This is the 4-hour leg that created the recent high. A 4-hour close below this level would be the first real sign of structural weakness. Underneath 6600.00 things get thin, but this is the definitive line.
Actionable Setup: A 4-hour close below 6584.84 would invalidate the immediate bullish thesis and shift our focus to the next major daily support level much lower.
The Breakdown Target: 6529.00
If the bullish structure fails and we get a confirmed close below 6584.84, this would be our next major downside target. It is the next significant area of untested daily support.
📌 Cheat Sheet – Key Levels Recap
🧠 Final Thoughts
The message from the SPX chart is clear: the bulls are still in control. The fact that the true index held its structure while the futures contract showed weakness is a significant tell. My plan is straightforward: I want to be a buyer on a dip into my A+ zone around 6615.28 - 6624.00. As long as we hold the line in the sand at 6584.84, the path of least resistance is higher toward 6693.75. We’ll let the market come to us and execute the plan.
Until next time—trade smart, stay prepared, and together we will conquer these markets!
Ryan Bailey, VICI Trading Solutions.
Daily / 4HR