

Welcome back, everyone. It was a hell of a Friday.
Many traders got demolished across the board, from the S&P 500 to crypto, which saw a massive sell-off. But I want to put things in perspective. Even after this drop, the S&P is still up over 40% since April. This is a very small, healthy, and needed pullback in the context of a massive bull run. We’ve been waiting for something to buy, and this is not a bad thing.
How We Saw This Coming
While nobody can call a 3% down move to the day, the market was talking to us, and we were listening. For those of you in the VICI community and following on Twitter, I’ve been talking about “top vibes” for some time.
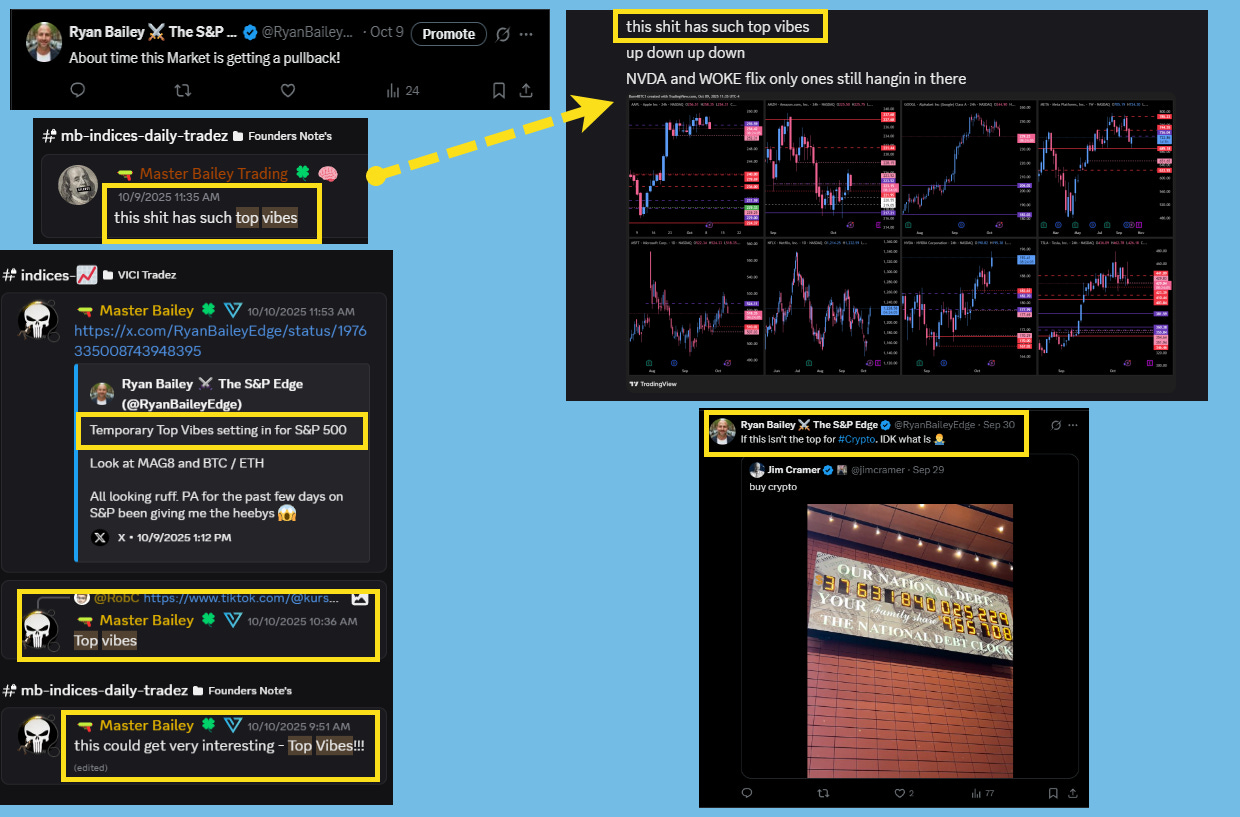
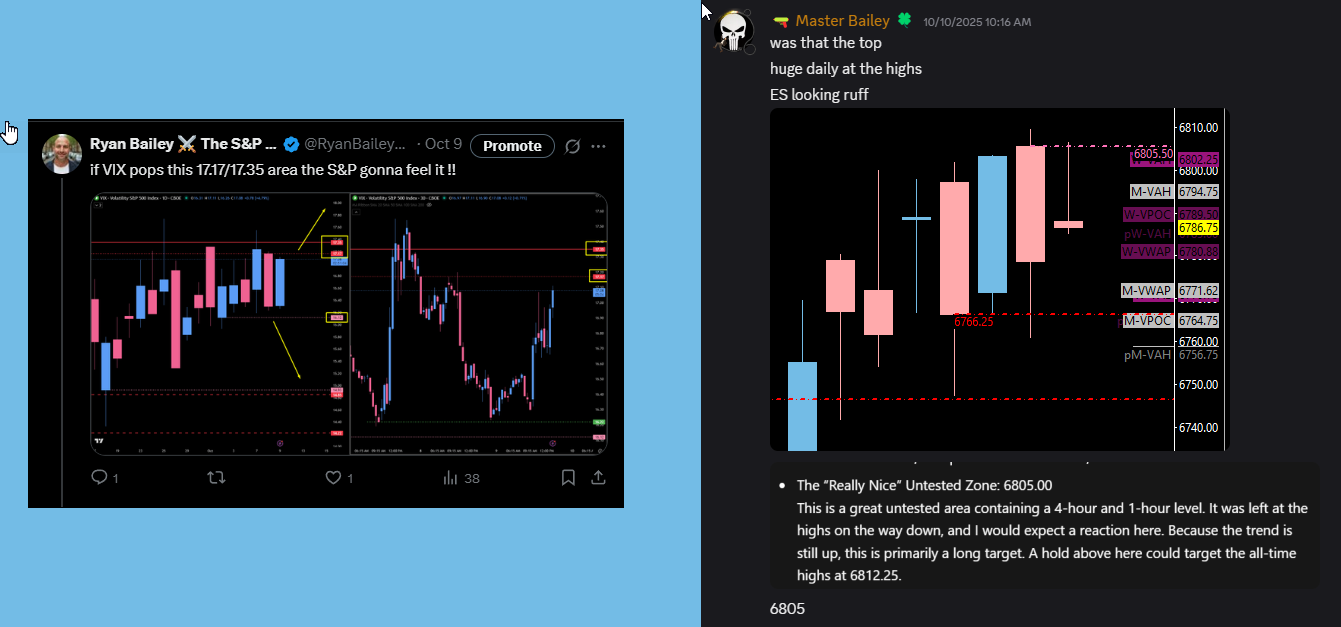
It started on September 30th when I was calling for the top in crypto. Then, on October 9th and 10th, I was tweeting about the “temporary top vibes setting in” for the S&P and the Mag 7. The price action was looking rough, with insane one-hour candles whipping straight up one day and straight down the next. It gave me the heebie-jeebies. On the morning of the drop, I was telling members this could be the high as we hit our 6760 SPX target and filled the excess on the ES profile. We had a pretty good feeling the top was in.
A Statistical Edge for Next Week
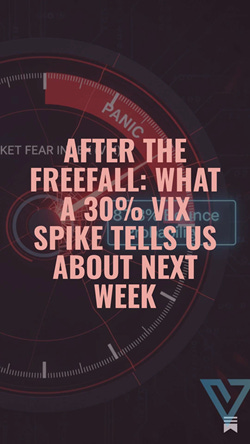
Now that we’ve had the free fall, what’s next? I just published a new Substack post on a powerful statistic concerning the VIX that you need to read.
Read the Full Post Here:
The key takeaway is this: looking at 30 years of data, after the VIX has a spike of over 20%, there is an 87% chance of a rally over the next two trading days. For Friday closes specifically, the probability is 76%. I’m not saying this is the bottom, but it gives us a strong mathematical probability for a knee-jerk reaction pop. We use these odds to size appropriately and look for the opportunity.
A Quick Request: Please Follow Me on Twitter!
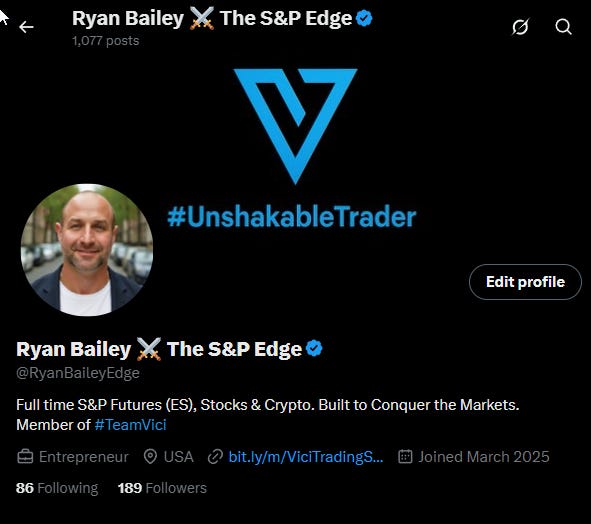
Many of you know my original Twitter account with over 4,000 followers was hacked, and I had to start from scratch. My new handle is @RyanBaileyEdge. My tweets don’t make it out to as many people as they used to, so a follow would be a huge help. It doesn’t cost you anything, and it might make you some money. I don’t doom post or share bullshit—I post actionable edge.
Follow Me on Twitter:
🎯 SPX High-Timeframe Trade Plan
I’m looking for opportunities to buy this pullback. Here are the high-timeframe levels I’m watching on the SPX.
🔴 Key Resistance & Profit-Taking Targets
Untested Resistance: 6715.00 & 6693.00
We have an untested weekly at 6715.00 and an untested daily at 6693.00. These would be key targets on any significant bounce.
Untested 4hr that produced an ATH: 6657.18
This is a highly probably spot to look for a reaction on SPX give the move it produced to an ATH. Watch this spot for a major reaction.
🔵 Key Support Zones & Setups
The “I Like This” Zone: 6529.00
This is a great spot containing an untested daily, 4-hour, and 1-hour level. The only way I can see this area not playing is if we gap significantly below it before the open. I expect a reaction here.
The “Great Spot”: 6401.51
This is my first ultimate target for this pullback and a fantastic opportunity to take a long. This is our weekly leg up. I love this spot.
Actionable Setup: If this holds, we want to see progression get back above the monster weekly pivot at 6445.00 to confirm the move up.
The “Bad Mamma Jamma”: 6238.00
This is the real leg to the high. While 6401.51 is the sub-leg, this is the big one. This area has a beautiful untested daily and weekly spot. I will be watching this area like a hawk.
The “Load the Boat” Zone: 5969.00
This is a banger down here. We have a monthly and a weekly level at 5969.00. All of these spots present amazing buy opportunities, but if we get down here, I would be looking to load the boat.
🎯 ES Futures High-Timeframe Trade Plan
The structure on ES looks very similar to SPX. I am done with shorting for now; we’ve made an extensive move down and are getting close to major support. It’s time to look for areas to buy.
🔴 Key Resistance & Profit-Taking Targets
The First Overhead Test: 6583.25
This 4-hour level previously served as support on a gap up. I’m not certain I’d short it, but it is the first area of significant overhead resistance.
Leg End on daily and 4hr Resistance at 5569 - 6660
Technically the daily is tested but the 4hr is not. given the significance of this area being the leg end i would look for a potential reaction here
The Major Resistance Zone: 6706.00 - 6716.50
This is a great 10-point zone that lines up perfectly with weekly and daily resistance at 6706.00 and a 4-hour level at 6716.50. I like how the confluence lines up here for a major test.
🔵 Key Support Zones & Setups
The “I Really Like This” Daily: 6516.75
This is the first major support zone I’m watching. It’s a key untested daily level. For this trade to be valid, we must be trading above it at the cash session open on Monday.
Actionable Setup: If this level plays, the trigger for continuation is a move back above the 6533.50 pivot.
“Love This Spot”: 6507.75
This is a great 4-hour level. We are now getting into the areas that never got played on the way up because momentum was so crazy.
Actionable Setup: This area has a nice trigger spot. If they play 6507.75, a move back above the wick at 6522.50 could really squeeze something nice.
“I Like This Too”: 6483.00
All of these are good; I’m planning on taking all of these trades. This is another great 4-hour level.
Actionable Setup: This trade has a clear trigger. If they play 6483.00 and price accepts back above the wicks and the daily pivot at 6489.00, we could get a nice push higher. That’s a two-for-one confirmation.
“I Really Liked This Trade”: 6440.00
This is a great spot. I wanted to buy this 4-hour level on the way up, and it never quite got there. Now we have our chance.
Actionable Setup: The trigger for this trade is acceptance above the wick at 6452.00. From there, we need to get back above the weekly at 6462.00 to target higher levels.
The Leg End Zone: 6397.00 - 6413.00
I like this spot a lot, a lot. This area contains the daily leg end at 6413.00 and 6398.00, and a 4-hour level at 6397.00.
Actionable Setup: A bounce from 6413.00 needs to get back above 6419.00 to show it has something. The ultimate confirmation is a reclaim of the super big weekly pivot at 6429.00.
🧠 Final Thoughts
This was a healthy pullback that we have been needing so badly. The price action has been terrible, and this flush gives us a chance to reset and find great opportunities. We are now coming into major support zones that were skipped on the way up. Based on the VIX statistic, the probabilities are in our favor for a relief pop in the next one to two days. The plan is to be patient and look for a bounce into resistance at one of these high-probability locations.
Have a fantastic weekend. I’ll see the guys in the room mañana.
Ryan Bailey, VICI Trading Solutions.

