

Happy Sunday.
We had a killer week last week, and the trade plans were absolutely on point. We also had a lot of fun doing the new post-market breakdowns, which I’ll be doing Monday through Thursday at 5 PM EST. It’s a free, 30-minute stream where we go over the ES plan, what played, and how to prepare for the next day, plus any crypto or stocks on the radar.
Before we get into the plan, I am offering a 30-day free trial to the Substack for a limited time. If you’re not a current subscriber, you are eligible. Check the link in the description, sign up, and come make some money with us.
Sign Up for 30 Days Free: [Click Here 4 Free Trade Plan Offer]
Join the 5 PM Post-Market Breakdown: [Link to Stream/YouTube]
🧠 The “Big Picture” Thesis: This Is Not a Top
I’m seeing a lot of “bear porn” talk on Twitter. I sincerely doubt it. Right now, we have no reason to be bearish other than just temporary weakness. We have two powerful statistics on our side:
The Golden Cross (100/200-day MA): As I posted about in August, this signal is good for 1-2 years and has historically led to major numbers. [Link to Golden Cross Post]
Fed Rate Cuts at All-Time Highs: As I posted last week (my most-read post ever), this has happened 5 times. The result? An average 20% up move one year after the cut. [Link to Fed Rate Cut Post]
This pullback is healthy, and I’m looking for areas to buy.
SPX Analysis: The “OG” Confirms the Structure
I’m starting with SPX because its structure is identical to ES, and it’s important to have this context. The levels line up perfectly. We have a ton of support in a 50-point range.
Resistance/Pivot: 6760.00 (Top-down daily from the all-time high)
Support 1: 6748.00 (4-Hour)
Support 2: 6733.00 & 6715.00 (Weeklies)
Support 3 (The Leg): 6688.00 (Main daily/weekly leg up, also an untested 4-hour)
Support 4 (Inception): 6629.00 (Daily & 4-hour, this is the equivalent of 6660.00 on ES)
🚨 VIX Analysis: The Question of All Questions
You and I both know TA on the VIX works, and it’s playing so freaking good it’s ridiculous.
The Main Pivot (Ceiling): 17.35 (Monthly). We’ve bumped our head here multiple times. Above this is bearish for ES.
The Key Test (Floor): 16.92 (Untested Daily / 16.91 4-Hour). This is the question of all questions.
The Setup: We are watching for a test of 16.92.
Bearish ES: If VIX bounces off 16.92 and pushes back up against 17.35, it could send the indices down to fill our lower gaps.
Bullish ES: If VIX fails at 16.92 and breaks down, we will get a lot of relief on the indices.
The “All Clear” (Bullish ES): Below the 16.17 weekly, the ES is “really, really bullish” and VIX is weak.
🎯 ES Futures: Detailed Actionable Trade Plan
As the TPO chart shows, we hit our 6950.00 extension target and are now pulling back, filling the gap that runs from 6811.00 down to 6790.00. This gap is littered with TPO-based support (like the 6792.00 POC and 6786.00 VAH) that lines up perfectly with our candlestick levels. I really think they need to come down first, so here are the zones I’m watching to buy.
🔴 Key Resistance Zones & Setups
The Main “Back Above” Pivot: 6918.25
This is the big 4-hour level that was our major smackdown spot. This is the main level we would need to get back above to confirm a move to new all-time highs.
The Untested 4-Hour Short: 6905.75
This is our only untested level to deal with on the upside. The 4-hour is losing support, and this is a key spot.
Actionable Setup: If they come up and play 6905.75, I want to see continuation back below 6900.00 and ultimately below 6893.00. This could come down pretty good.
🔵 Key Support Zones & Setups
The First Untested 4-Hour: 6855.00
This 4-hour and 1-hour level is technically untested.
Actionable Setup: They could come down, play this, and drift back up to test the 6905.75 resistance.
The “Gap Fill / Reclaim” Setup: 6805.50
This is the all-time high leg down from the daily chart. It’s a level you don’t want to ignore after a 200-point smack.
Actionable Setup: Because of the large gap, I’m cautious of resting orders. I’m looking for 6805.50 to play, then get back above the previous all-time high at 6812.00. That reclaim is the trigger.
The “Really Good Spot”: 6788.50
This is an epic weekly level that played so many times. It’s a great spot, filling the gap and aligning with the TPO POC at 6792.00 and VAH at 6786.00.
Actionable Setup: I like this a lot. The play is a test of this zone and then a reclaim back above 6805.00 and 6812.00. It has a lot of promise.
The “Watch” Level: 6774.00
This daily is contained and I’m not in love with it, but it’s here. It lines up with the 6776.00 TPO naked POC, the 20-day MA, and the monthly VWAP.
Actionable Setup: I would really have to wait for it to get back above 6788.50 before buying. A safer play is to wait for it to break above 6788.50 and then buy a pullback into it.
Leg Down Top Down Weekly: 6761.75
This Weekly provided a great reaction from the bottom up and the top down. It is also located very close to the monthly VWAP
Actionable Setup: We need to see a pop from this level and sustained buying above the daily at 6766.25 before engaging and follow through above the 6774.25 daily for confirmation.
“The Jam” / My Favorite Buy Zone: 6736.00 - 6738.75
This is the daily leg up, the ETH daily leg up, a 4-hour, and aligns with the 6732.00 weekly VAH. This is the jam. It’s super juicy. I love this spot.
Actionable Setup: This is a phenomenal trade. I’m looking for this level to get above 6745.00 for confirmation. You can take targets around 6761.00 (15-16 points).
The “Last Area” / 50-Day MA: 6660.00
If the “Jam” fails, I don’t have anything else until 6660.00. This is the last area, and it’s “super sexy” as it lines up with the 50-day moving average.
Actionable Setup: This is the play we do over and over. Wait for 6660.00 to play, then get back above the other tested daily at 6664.00. That’s the trigger.
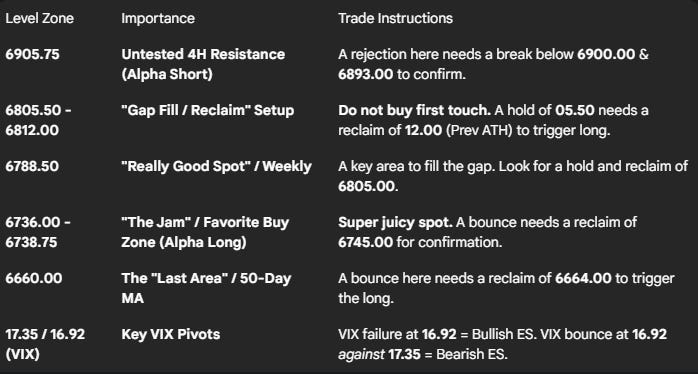
📌 Cheat Sheet – Key Levels Recap
🧠 Final Thoughts
That’s what I got for you. We’re stopping there because that covers you for over 200 points of downside. The plan is to look for this temporary weakness to give us an opportunity to buy at one of these high-confluence, “super juicy” spots. We have no reason to be bearish long-term.
Don’t forget to sign up for the 30-day free Substack trial if you’re not a subscriber. I’ll see you all Monday for the first post-market breakdown.
Until next time—trade smart, stay prepared, and together we will conquer the markets!
Ryan Bailey, VICI Trading Solutions.
