
S&P 500 Daily Trade Plan: State of the Union Digestion & The 6964 Resistance
A detailed ES & VIX plan for Feb 25th, breaking down the 6903 Make-or-Break support, the massive 6964.50 resistance, and the SPX/ES discrepancy.
SCHEDULED NEWS
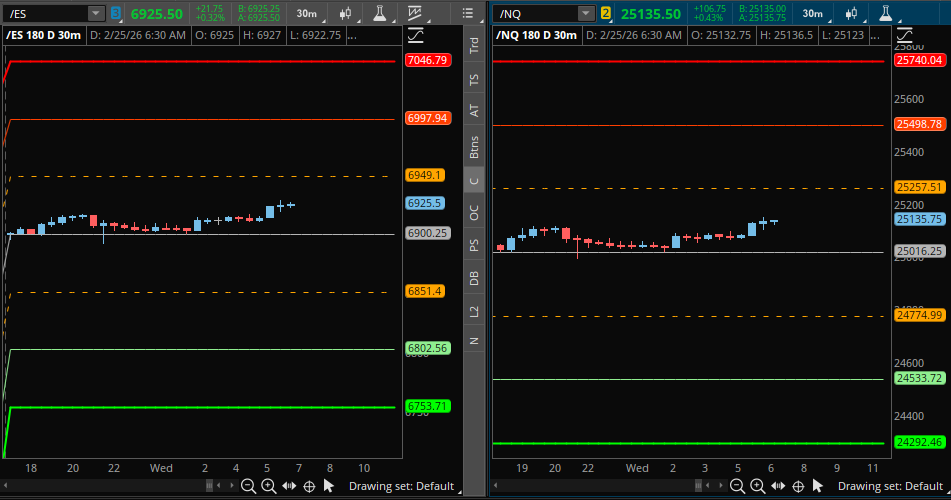
OPTIONS VOLITILITY LEVELS
Good morning everyone. Today is Wednesday, February 25th, and we come off an unbeatable day yesterday with the trade plans. We had every single level play out (4) and they paid between 30 and 13 points each! It was a fantastic day for Substack subscribers. We had the low sweep of 6835.00 that essentially squeezed us all day and into our current price now, as well as the rotation off of our famous Weekly at 6883.00 which paid 30 points, amongst other amazing trades yesterday from the plan. Huge congratulations to all those who took advantage of yesterday, for there was some serious money to be made. I once again appreciate all the DMs from everyone telling me how appreciative they are. Let’s continue to do it again today.
🚨 IMPORTANT NOTATION FOR READERS 🚨
Please note that this is a very detailed and very important trade plan to view. As we are coming to some very significant areas, I express my thoughts in detail, and people need to understand the reasoning as I continue to express my bias both long-term and short-term and how this could potentially play out. This is not a trade plan to skim over, but a trade plan to study and analyze.
A Note on Today’s Market:
News: We are fresh off of yesterday’s State of the Union Address by President Trump. The market clearly digested this information last night, and we are up over 23 points in the overnight session.
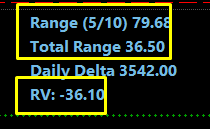
Volume: Relative Volume is -32%. This could stifle our expected range potentially, and we could fall slightly short if participants don’t show up after the open.
Range: Expected range of approximately 80 points. We’ve currently moved 36 points in the overnight session, leaving approximately 35 points left in the tank above or below the overnight high.
Gamma: We are currently in Negative Gamma regime once again. Our gamma flip level is well above the All-Time Highs. Dealers are hedging short; expect volatility and money to be made in both directions.
Trend: Our high-timeframe lean is still to the downside, but the short-timeframe intraday perspective is potentially to the upside as long as we hold certain levels this morning.
🧠 Current Market Context
The Massive Balance & Distribution
We are currently sitting in a massive 4-week balance area, and technically as we’ve moved up higher, we are in a 6 or even potentially 7-week balance area, putting us right smack dab in the middle of a huge range. When we have balance areas like this, it makes it extremely hard to pick an exact direction for the long term. We simply rely on our process and our significant Above/Below levels to monitor momentum.
The SPX vs. ES Discrepancy
SPX is the true index. SPX has not lost on the Daily timeframe and continues to guide us higher, pulling a complete inverse of the ES futures which have continued to lose support. This gives us one more challenge to deal with. Based on SPX, we could push to All-Time Highs if we get above 6914.11. If that happens, SPX has a massive untested high lost area at 6939.00 to 6945.00. I expect a reaction there. If SPX stays above 6914.11 after reacting to the 6939 area, we could push to ATHs. I will use this as confluence when ES approaches its massive 6964.50 level.
The Weekly Inefficiency
On ES, we have a massive area on the weekly profile from 6938.00 all the way to 6965.00 that is a potential spot that needs to get filled in. This area has little resistance up into 6965.00 (previous Weekly POC). They will be targeting this to fill the market inefficiency.
