
SCHEDULED NEWS

OPTIONS VOLITILITY LEVELS
Important Subscriber Notices
Before we get into today’s plan, please check your spam, junk, and promotions folders for emails from rbailey@vicitradingsolutions.com and info@vicitradingsolutions.com.
I’ve been sending follow-ups and touch points to subscribers, as well as those subscribed to the SPX Brief, and I can clearly see that many of these emails are not being opened because they are getting caught in spam. Please mark these emails as not spam so you continue receiving important updates, reminders, and valuable information directly in your inbox.
Also, do not forget to sign up for the How to Trade a Trade Plan webinar. I only do this webinar once a month, and it is designed to give you step-by-step direction on how to better interpret the trade plans and get the most out of them. I’ll also be doing a live Q&A at the end where you can ask me anything you like.
Even if you cannot attend live, make sure you register. Everyone who registers will receive the replay, and registered attendees will also be eligible to win two free prop firm evaluations that I’ll be giving away live at the end of the stream.

Morning everyone. Today is Thursday, May 28th, and we came off another awesome day in the trade plan. Yesterday we were able to lean on our significant 7527.00 Daily to provide first-touch reactions not once, but twice. Then we leaned on the 7543.75 4-hour area for a short in the morning session, and later in the day we had a beautiful sweep of the previous day’s low followed by a reclaim of the 7527.00 Daily, which led us higher in the afternoon session by roughly 45 points.
Congratulations to everyone who took advantage of the trade plan yesterday. It was a slow and painful day at times, but patience paid as usual, and trade plan subscribers came out on top.
Coming into this morning, we have our first Red Tag news of the week with Core PCE and Preliminary GDP at 8:30 a.m. ET. This is a very important number as we continue to traverse sideways near all-time highs after the holiday. The market has been digesting this new range all week, and today’s data may finally help determine whether we break higher or push lower out of this multi-day balance.
A Note on Today’s Market:
News: Core PCE and Preliminary GDP hit at 8:30 a.m. ET. These are our first major Red Tag events of the week and can easily create volatility.
Volume: Participation has been muted inside this balance, but the red-tag news should bring volume into the market and potentially force a decision out of the range.
Range: Expected range is 67 points. We have already moved 52 points in the overnight session, leaving roughly 15 points above or below the overnight high or low for potential range extension.
Gamma: We still have a very strong positive skew to the call side and remain in Positive Gamma, with dealers hedging to the upside. The gamma flip level is more than 125 points lower, so even a pullback here still leaves the higher-time-frame and dealer hedging backdrop pointed higher.
Trend: We are still up on all major timeframes, including the 1H, 4H, and Daily, but cracks are starting to show on the 4H as support continues to close lower. We remain process-first: the trend is still up, but the market is overextended, balanced, and vulnerable to a downside flush if key support fails.

🧠 Current Market Context
The Multi-Day Balance and the 7507 Line in the Sand
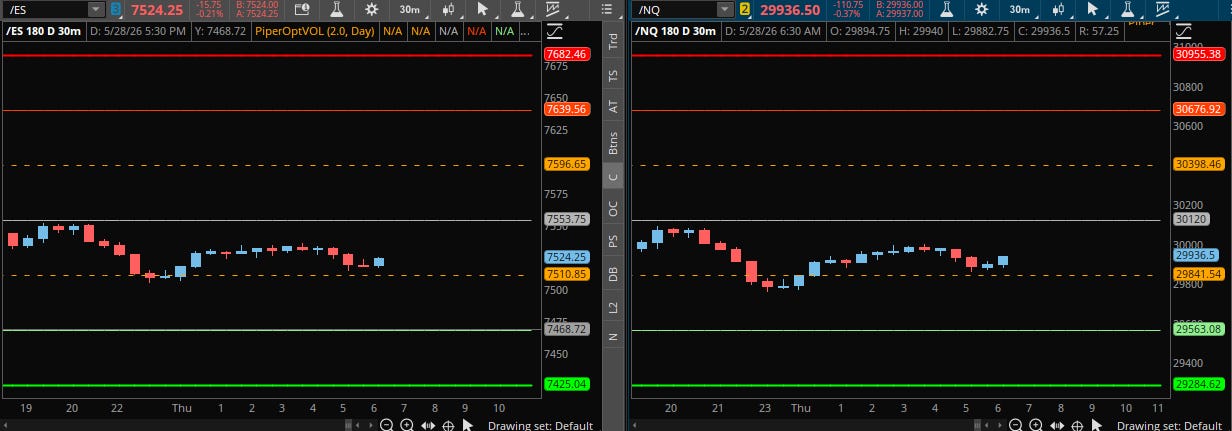
ES has been moving sideways in a tight range of roughly 50 points since the holiday. We are sitting near all-time highs, but the market has not made a decisive directional move. Price is digesting this new range, and today’s red-tag data could be the catalyst that finally pushes us out of balance.
The bigger picture is still bullish. We have not lost any major timeframe, and options positioning remains supportive. But that does not mean we ignore the warning signs. We are overbought, historical indicator data continues to suggest potential downside over the next 5–10 days, and the market has started to print lower highs and lower support closes on the 4H. That tells me we need to stay alert. The process still comes first, but the market is not as clean as it was during the initial impulse higher.
