
S&P 500 Daily Trade Plan: Holding the 7527 Line & the 7500 Gamma Flip
A detailed ES & VIX plan for June 4th, breaking down the 7527 major support to the all-time high, the 7500 gamma flip defense, and the VIX 16.20 midpoint pivot.
SCHEDULED NEWS

OPTIONS VOLITILITY LEVELS
📬 Quick Notice — Please Check Your Spam Folder! Before we dive in: if you’re a subscriber — or you’ve signed up for the SPX Brief — please take ten seconds to check your spam/junk folder for my emails coming from rbailey@vicitradingsolutions.com and info@vicitradingsolutions.com. I’ve been sending out follow-ups and touch-ups to everyone, and I can clearly see a lot of them are getting buried in spam and never making it to your inbox. Mark them as “Not Spam” and add me to your contacts so you don’t miss a thing — there’s real value in those emails. In fact, I sent one out this morning about the Indicator Suite you can take advantage of, so if you don’t see it, go dig it out of spam. Don’t miss it!
Morning everyone. Today is Thursday, June 4th, and we come off another ridiculous day in the trade plan. We used our 7585.00 above/below barometer, and the moment price slipped below it we knew the bulls were in danger. We had our significant four-hour level where we were looking to play a long at 7597.00, but the actionable setup kept us out of that long and saved us from a loss. Instead, we played the backside of 7597.00 for a monster short that brought us all the way down into our 7564.00 Daily for an amazing pop of approximately 25 points — only to continue sending us lower and put us directly on our major significant daily leg at 7542.00 that we’ve talked about time and time again. Congratulations to all those who took advantage of an insane day — we finally got some volatility, moved out of the range, and made serious money for our subscribers. I appreciate all the DMs that came in. Let’s keep conquering these markets.
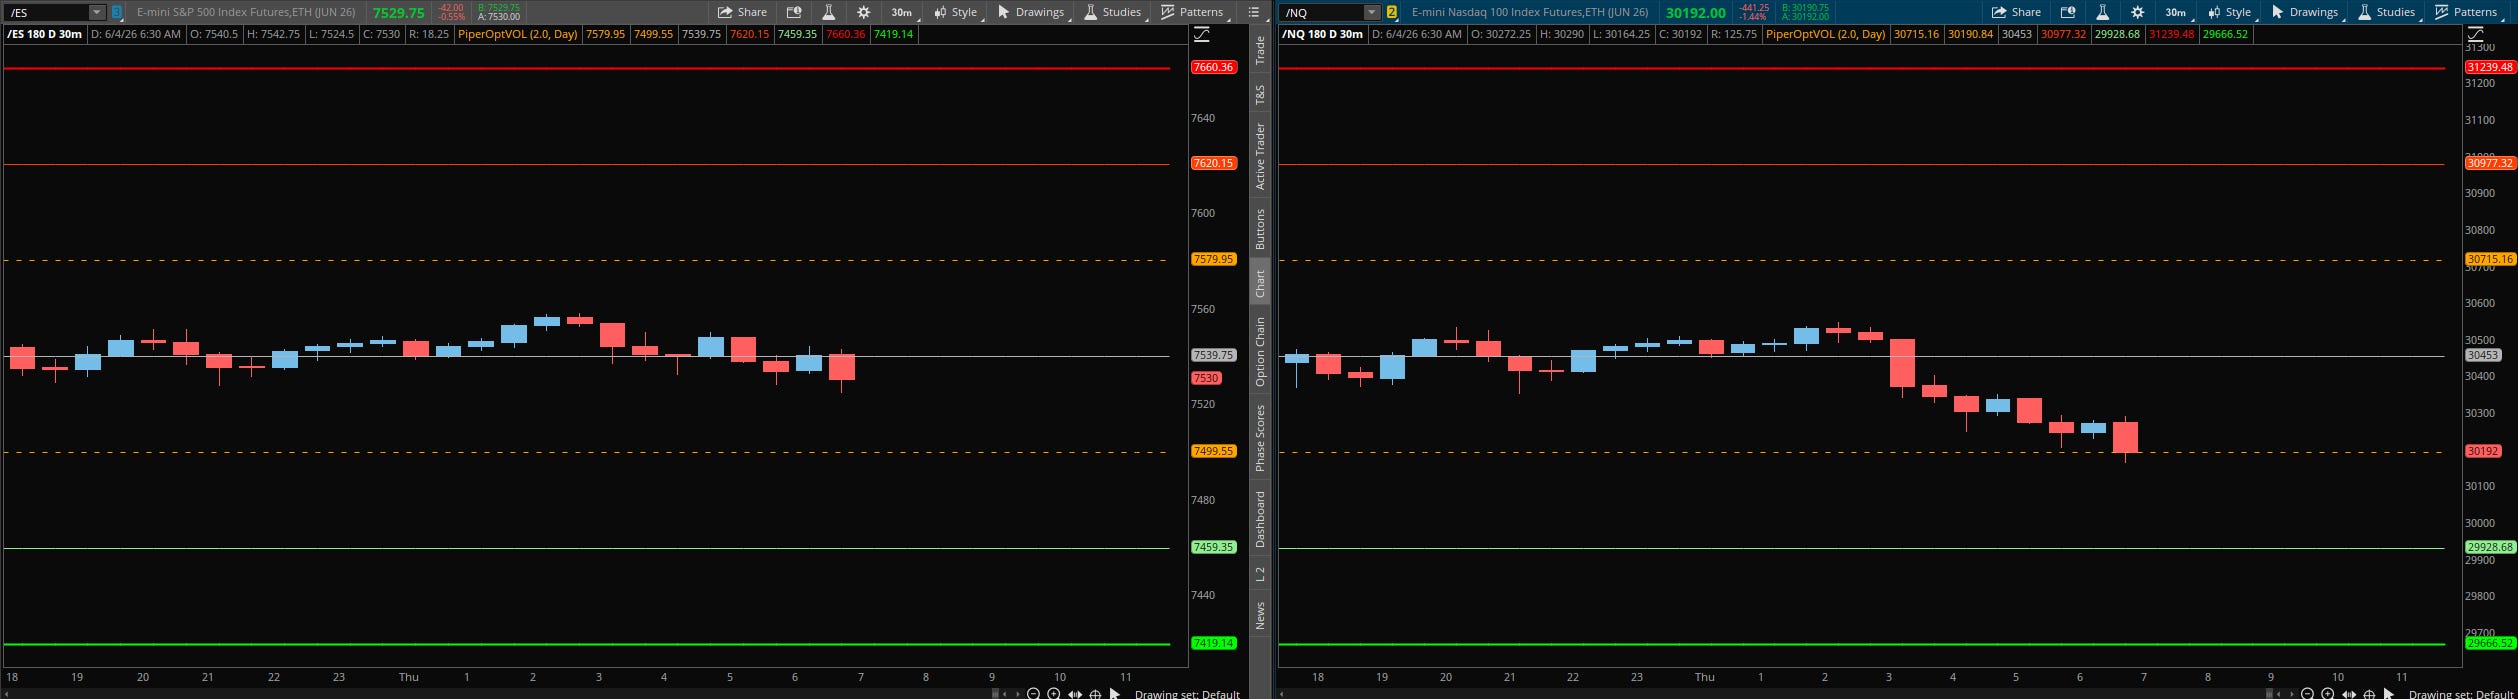
As we come into the day today, we find ourselves in an interesting position. We’ve continued to move sideways in the overnight session in a tight range of just 33 points, basing out and holding our significant Daily at 7527.00 — the same level that has held our structure up for weeks. Price looks like it’s potentially accepting value and accumulating down here. That doesn’t mean we automatically go up; we need to understand what we have to be above for momentum to break higher, and where things go bad below.
A Note on Today’s Market:
News: No major Red Tag news to speak of today, but we do have Unemployment Claims at 8:30 AM which could inject some volatility. Stay alert into that print.
Volume: Relative Volume is elevated at +28.5%. This means more active participants than usual and gives us a little more room — roughly an extra 16 points added to our range.
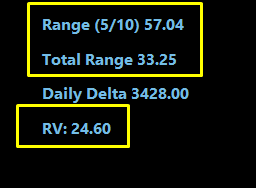
Range: Expected range of 57 points. We’ve only moved 33 points in a tight overnight session, and with relative volume factored in, that leaves us approximately 41 points above or below the overnight highs or lows — plenty of room to make money today.
Gamma: We are in Positive Gamma territory with dealers hedging to the long side. Our gamma flip level sits at 7500.00, strategically placed directly below the structure we need to hold. As long as dealers hold this morning’s lows, we should stay in positive gamma.
Trend: We remain up on the Daily and Weekly timeframes, which is our default, and Positive Gamma points us higher. However, we took our first loss on the 4-Hour yesterday, so we’re starting to show cracks on the higher timeframe. This is a make-or-break spot — the bulls are not fully in control, so trade with caution.
🧠 Current Market Context
The Make-or-Break at Major Support
We came down yesterday for the first time in a long time, and we are now sitting directly on major support that is truly the make-it-or-break-it line — the deciding point for whether the bulls continue their push toward the highs or fail and fall potentially 100 points lower. We are holding the significant Daily at 7527.00, which has now played for the fourth time, holding three previous times in cash sessions on May 26th, 27th, and 28th. This is our support to the all-time high, and it’s been propping our entire structure up. Right alongside it sits the Previous Weekly POC at 7529.75 and the very significant tested 4-Hour at 7523.50. This zone kept price propped up all night, and the sideways action on the 30-minute and 15-minute candles looks very much like accumulation — if they wanted to push below, they had all night to do it and didn’t.
