
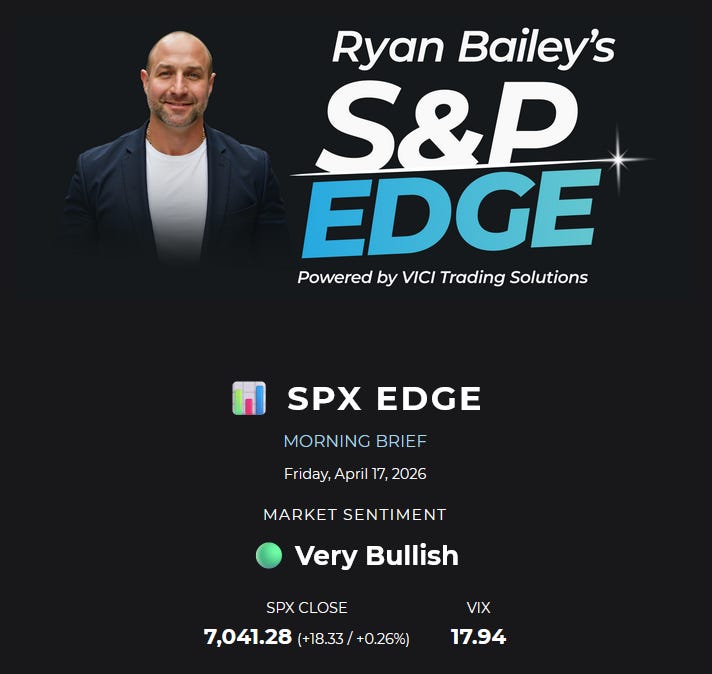
📊 Introducing The SPX Brief: The Morning Edge I’ve Been Waiting to Give You
Institutional-grade S&P 500 intelligence, delivered to your inbox every weekday before the opening bell. Free for Charter Readers.

For years, I’ve started every trading day the same way.
Before I place a single order, I build a complete tactical map of the S&P 500 — where value sits, where institutional benchmarks are priced, which historical patterns are firing today, what the sentiment tape looks like, and what news is about to move the market in the first hour.
It takes time. It takes experience. And frankly, most retail traders simply don’t do it — not because they don’t want to, but because the tools, the data, and the framework to pull it all together aren’t easily accessible.
That’s the gap The SPX Brief closes.
Today, I’m officially launching it — and I want you to have it.
👉 Claim Your Free Charter Access Here
What The SPX Brief Actually Is
The SPX Brief is a daily morning intelligence report on the S&P 500, delivered to your inbox every weekday before the market opens.
It’s the same prep I do for myself — now systematized, formatted, and shipped to you so you can walk into the session with the same clarity an institutional desk does.
No opinions. No noise. No “here’s what I think will happen today.”
Just the data. The levels. The patterns. The sentiment. The headlines.
You read it in about 90 seconds, and you’re ready.
Why This Matters
Here’s the truth most traders don’t want to hear:
The market is not random. It’s patterned, it’s structured, and it’s heavily influenced by the same institutional reference points every single day — reference points most retail traders have never heard of, let alone know how to use.
Professionals trade around value areas, points of control, time-weighted averages, and statistical expectancy. Retail traders trade around candles and moving averages they pulled off YouTube.
Is it any wonder the edge flows the way it does?
The SPX Brief flips that script. It gives you the same reference frame the professionals use, distilled into a format you can actually act on before 9:30 AM.
What’s Inside Every Brief
Let me walk you through each section — not just what it is, but why it matters and how to use it.
🎯 Daily, Weekly & Monthly SPX Key Levels
Every brief opens with the Value Area High (VAH), Point of Control (POC), and Value Area Low (VAL) across three timeframes — daily, weekly, and monthly.
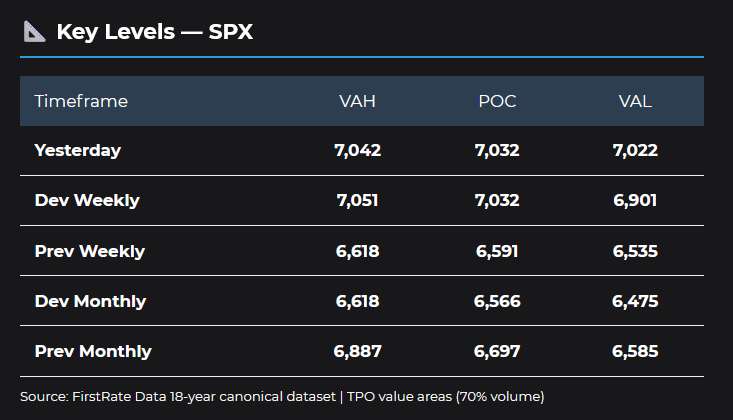
Why it matters: These aren’t arbitrary lines. They’re statistically derived price zones that represent where 70% of volume traded during a given period. Institutions defend them, revisit them, and react to them — which means when SPX approaches these zones, something usually happens.
How to use it: Treat VAH/VAL as your high-probability reaction zones. POC is your magnet — price tends to gravitate back toward it. When SPX is above the prior day’s VAH, you’re in a bullish extension. Below VAL, bearish extension. Inside value, expect rotation. This alone will change how you frame every setup.
📈 Weekly & Daily Market Profile Charts
Each brief includes the visual TPO (Time Price Opportunity) charts for both the developing weekly profile and the daily migration.
Why it matters: Market Profile is how floor traders and institutional desks have visualized auction theory for decades. It shows you where value is forming, where it’s overlapping, and where it’s breaking.
How to use it: Overlapping value across days = balanced, range-bound market (favor fade strategies). Migrating value = trending market (favor continuation). Spotting this at 8:30 AM tells you which playbook to run that day — before you even take your first trade.
⚡ The TWAP Scanner
Time-Weighted Average Price (TWAP) is one of the most underrated institutional benchmarks in existence — and almost no retail trader uses it correctly, if at all.
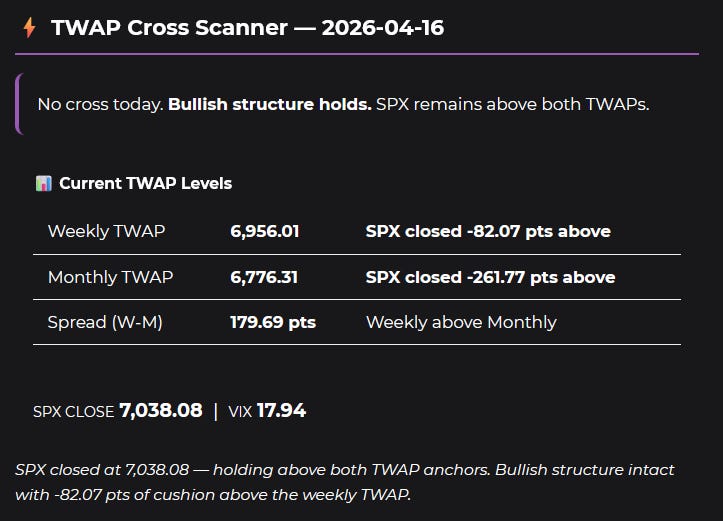
Why it matters: Institutions use TWAP to execute large orders without moving the market. It’s the benchmark they’re measured against. When SPX is trading below weekly or monthly TWAP, it means institutional flow has been net distributive. Above it, net accumulative. That’s not opinion — that’s measurable value flow.
How to use it: The TWAP Scanner in each brief tells you exactly where SPX sits relative to weekly and monthly TWAP, and by how many points. When price is extended above TWAP, mean-reversion trades get interesting. When it’s pressing below with momentum, continuation shorts align with institutional flow.
You’re no longer guessing which side of value you’re on. You know.
🧠 Pattern Intelligence Report (150+ Indicators)
This is the engine room of the brief.
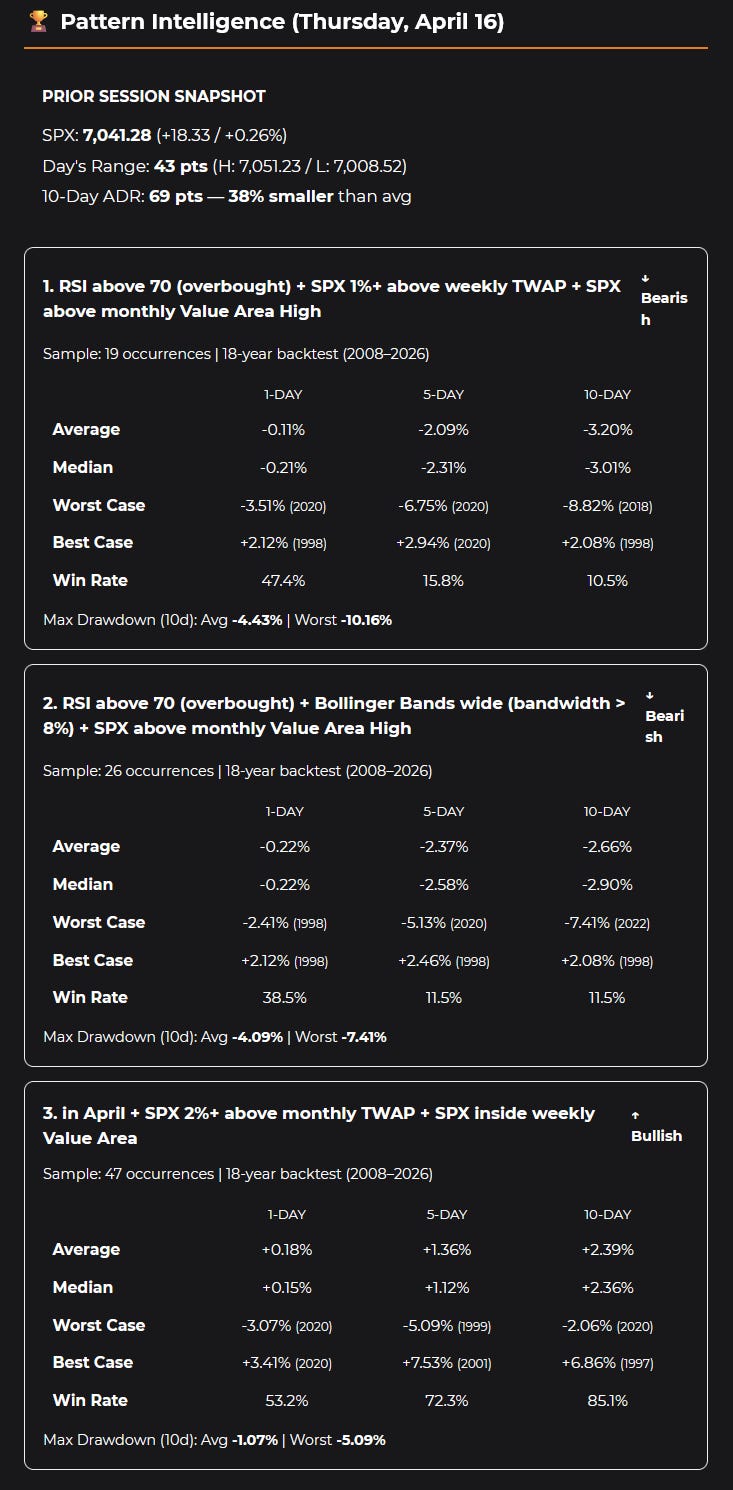
Every morning, a proprietary scanner runs today’s SPX setup against 150+ technical, breadth, volatility, and sentiment indicators — and cross-references it against decades of historical data to find matching conditions.
You get a statistical breakdown of what happened next every time these conditions lined up historically:
Average 1-day, 5-day, and 10-day forward returns
Median returns
Best and worst case outcomes
Win rate
Sample size and confidence rating
Why it matters: This is the difference between trading on a hunch and trading on back-tested expectancy. You’re no longer asking “what do I think will happen?” You’re asking “what has happened every other time conditions looked like today?”
How to use it: When multiple patterns line up with high win rates on the same forward timeframe, you have a statistically significant edge. When they conflict, you know to size down or stay patient. It’s quantitative discipline without needing a PhD in statistics.
📊 Key Insights — Bull/Bear Sentiment & Volatility Scoring
Each brief includes a sentiment dashboard: Bull Score, Bear Score, Volatility Regime, and Sample Confidence.
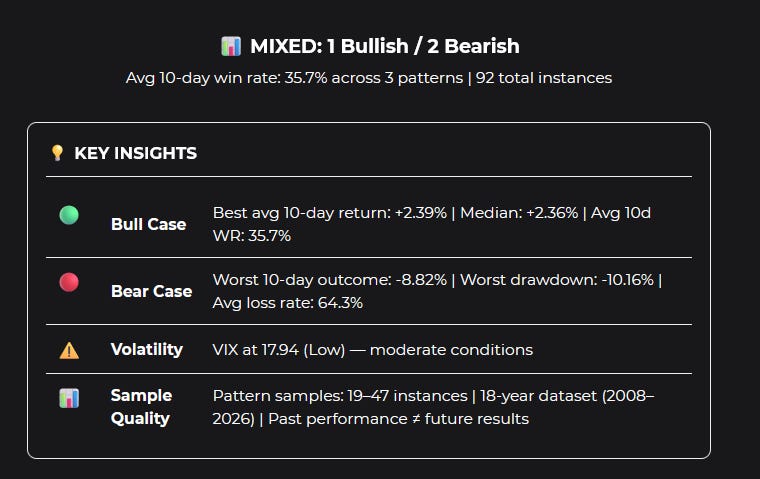
Why it matters: Sentiment moves markets. But “sentiment” is thrown around so loosely in financial media that it’s lost all meaning. The brief quantifies it — giving you a numerical read on where the tape actually sits.
How to use it: High Bull Score + low volatility = trend-day environment. High Bear Score + elevated volatility = aggressive short setups favored. Mixed reads = chop, favor tight scalps or sit out. Matching your strategy to the regime is one of the fastest ways to reduce drawdown.
📰 Top 5 Market-Moving Headlines (Pulled at 4 AM)
Every brief closes with the five most important headlines pulled fresh at 4 AM — earnings surprises, Fed commentary, geopolitical events, macro data releases, sector-moving news.
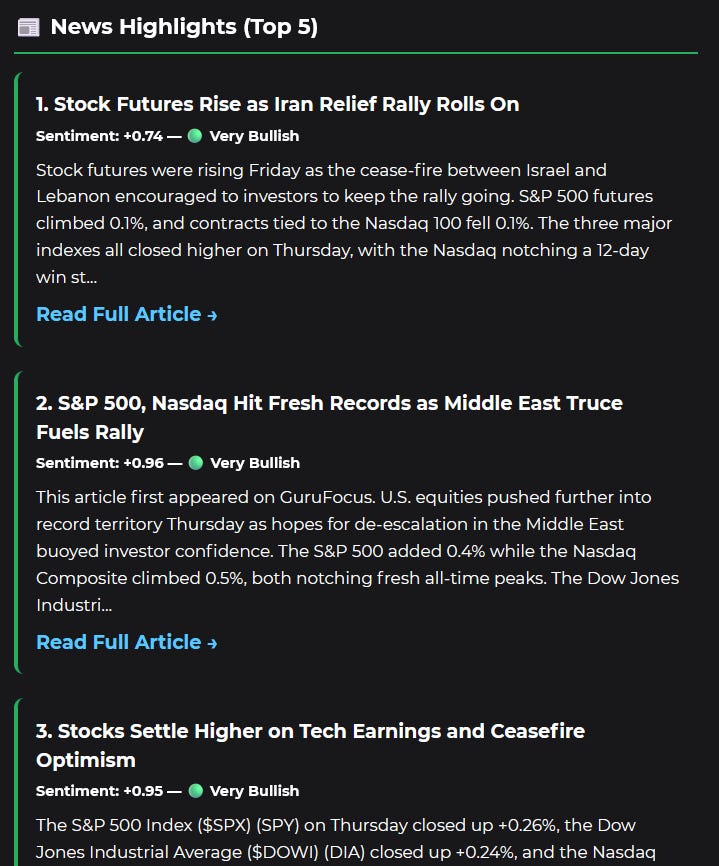
Why it matters: A great technical setup can be invalidated instantly by a headline you didn’t see coming. Conversely, the right piece of news can supercharge a setup you would’ve sized small.
How to use it: Scan it before you sit down at your screen. It takes 30 seconds. It can save you thousands.
👉 Claim Your Free Charter Access
Why I’m Giving This Away Free
Honest answer? Because I built it for myself first.
This is quite literally what I look at every morning with my coffee — before I do anything else.
I have an API pulling market headlines at 4 AM with a strict filter: nothing older than 8 hours makes it in. That way, when I wake up, I’m reading the freshest news possible — not yesterday’s narrative recycled by financial media.
From there, I want to know where value actually sits. Value Area Highs, Points of Control, and Value Area Lows for SPX across daily, weekly, and monthly timeframes — I mark these manually every morning based on the data. You rarely see these published anywhere for SPX. Most platforms don’t bother. But they’re some of the most reliable reference points in the market.
Then there’s TWAP. Most traders default to VWAP — but here’s the problem: SPX has no volume. It’s an options-based product, not a traded security. VWAP is mathematically meaningless on SPX. So I built my own solution using the institutional standard — Time-Weighted Average Price — and even published a TradingView indicator specifically to solve this problem for anyone who wants it, completely free.
📈 Get the SPX TWAP Edge Indicator on TradingView →
Finally, I want to know where we sit on overbought/oversold conditions across a wide array of indicators — not just one or two, but enough to build real statistical context around today’s setup.
All of this runs automatically for me every morning. One day it occurred to me: if this is saving me an hour of prep and genuinely making me a better trader, my subscribers would probably find it useful too.
So here it is. Same data. Same format. Same brief. Free during the Charter launch.
👉 Claim Your Free Charter Access
How to Get It (It’s Stupid Simple)
Here’s all you have to do:
Click the link below.
Enter your name and email on the landing page.
That’s it.
Your first SPX Brief will land in your inbox before the next market open. Every weekday after that, you’ll wake up to institutional-grade prep — ready to trade.
No credit card. No strings. No friction.
👉 Get My Free Charter Access
A Final Word
I’ve watched too many smart, disciplined traders lose money simply because they didn’t have the right information in front of them at the right time.
The SPX Brief fixes that.
If you trade the S&P 500 — or anything correlated to it (SPY, ES futures, sector ETFs, index options) — this is the edge I’ve built specifically for you.
Charter spots are limited. Lock yours in now.
👉 Start My Free Charter Access →
See you in the inbox before the bell. 🔔
— Ryan Bailey Founder, VICI Trading Solutions Creator of The S&P Edge
Do you have a discord?