
How We Use Options Volatility Levels to Map the Market’s Expected Range Every Day
These proprietary deviation levels tell us how far price is likely to travel—and when it’s gone too far. Here’s exactly how to read them.

If you’ve ever entered a trade with solid structure behind it, watched it work beautifully, and then sat there wondering where do I take profit?—you already understand why targets matter just as much as entries.
Entries get all the attention. Everyone wants to know where to get in. But what separates a good trader from a great one is knowing where price is likely to run out of steam—and having the data to back that up before the session even begins.
That’s exactly what the S&P Edge Options Volatility Levels are designed to give you.
What Are the Options Volatility Levels?
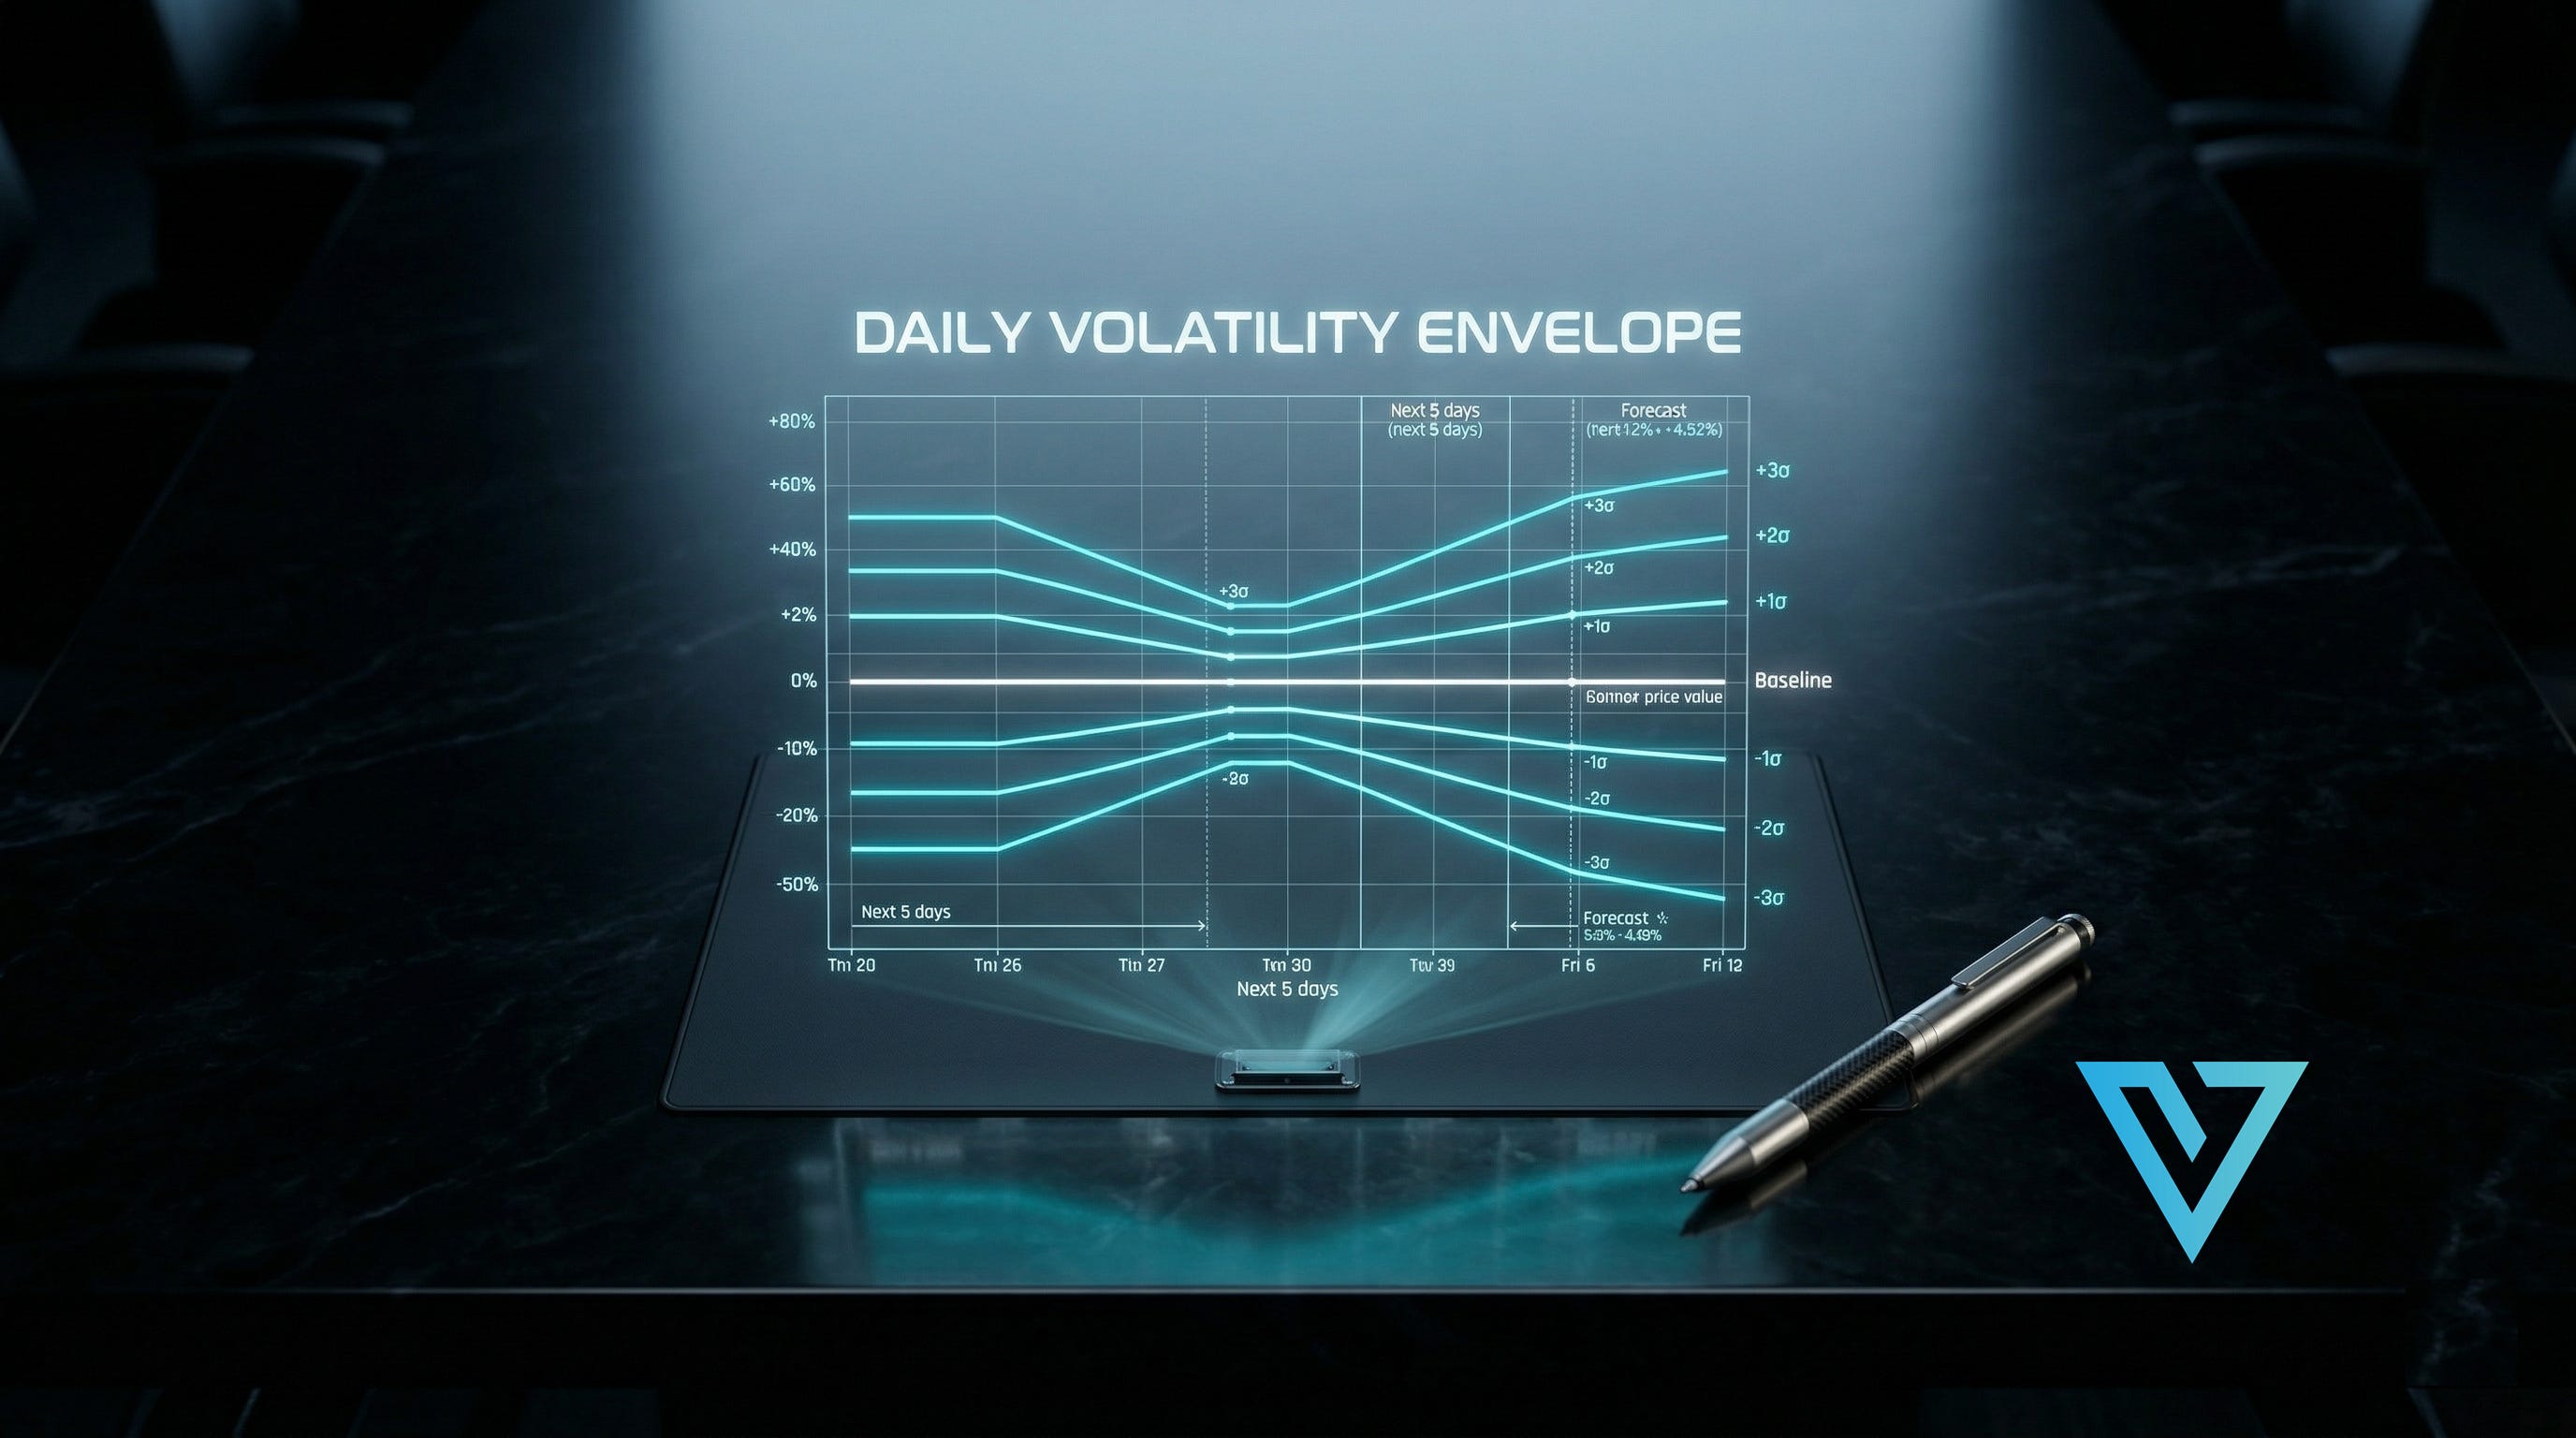
Every day in your trade plan, you’ll see a set of horizontal lines extending above and below a central baseline. These are the S&P Edge Options Volatility Levels, and they represent a calculated projection of how far the ES is likely to travel in a given session based on the current options environment.
Here’s the key: these levels are calculated from the daily implied volatility across all option strikes and open symbols for the ES. This isn’t a guess. This isn’t a moving average or a Fibonacci retracement. This is the options market itself telling us what kind of range to expect—derived from the collective positioning of every options contract currently open on the S&P 500 futures.
Experienced traders understand that options market makers possess an almost instinctive sense of potential market movement and expected ranges. They price risk for a living. By aggregating the implied volatility data across every strike, we’re essentially tapping into that intelligence and translating it into actionable price levels on your chart.
Think of these levels as a market heatmap—they’re there to inform and enhance your trade setups, serving as benchmarks rather than absolute predictors.
How to Read the Chart
The structure is clean and straightforward. Here’s what you’re looking at:
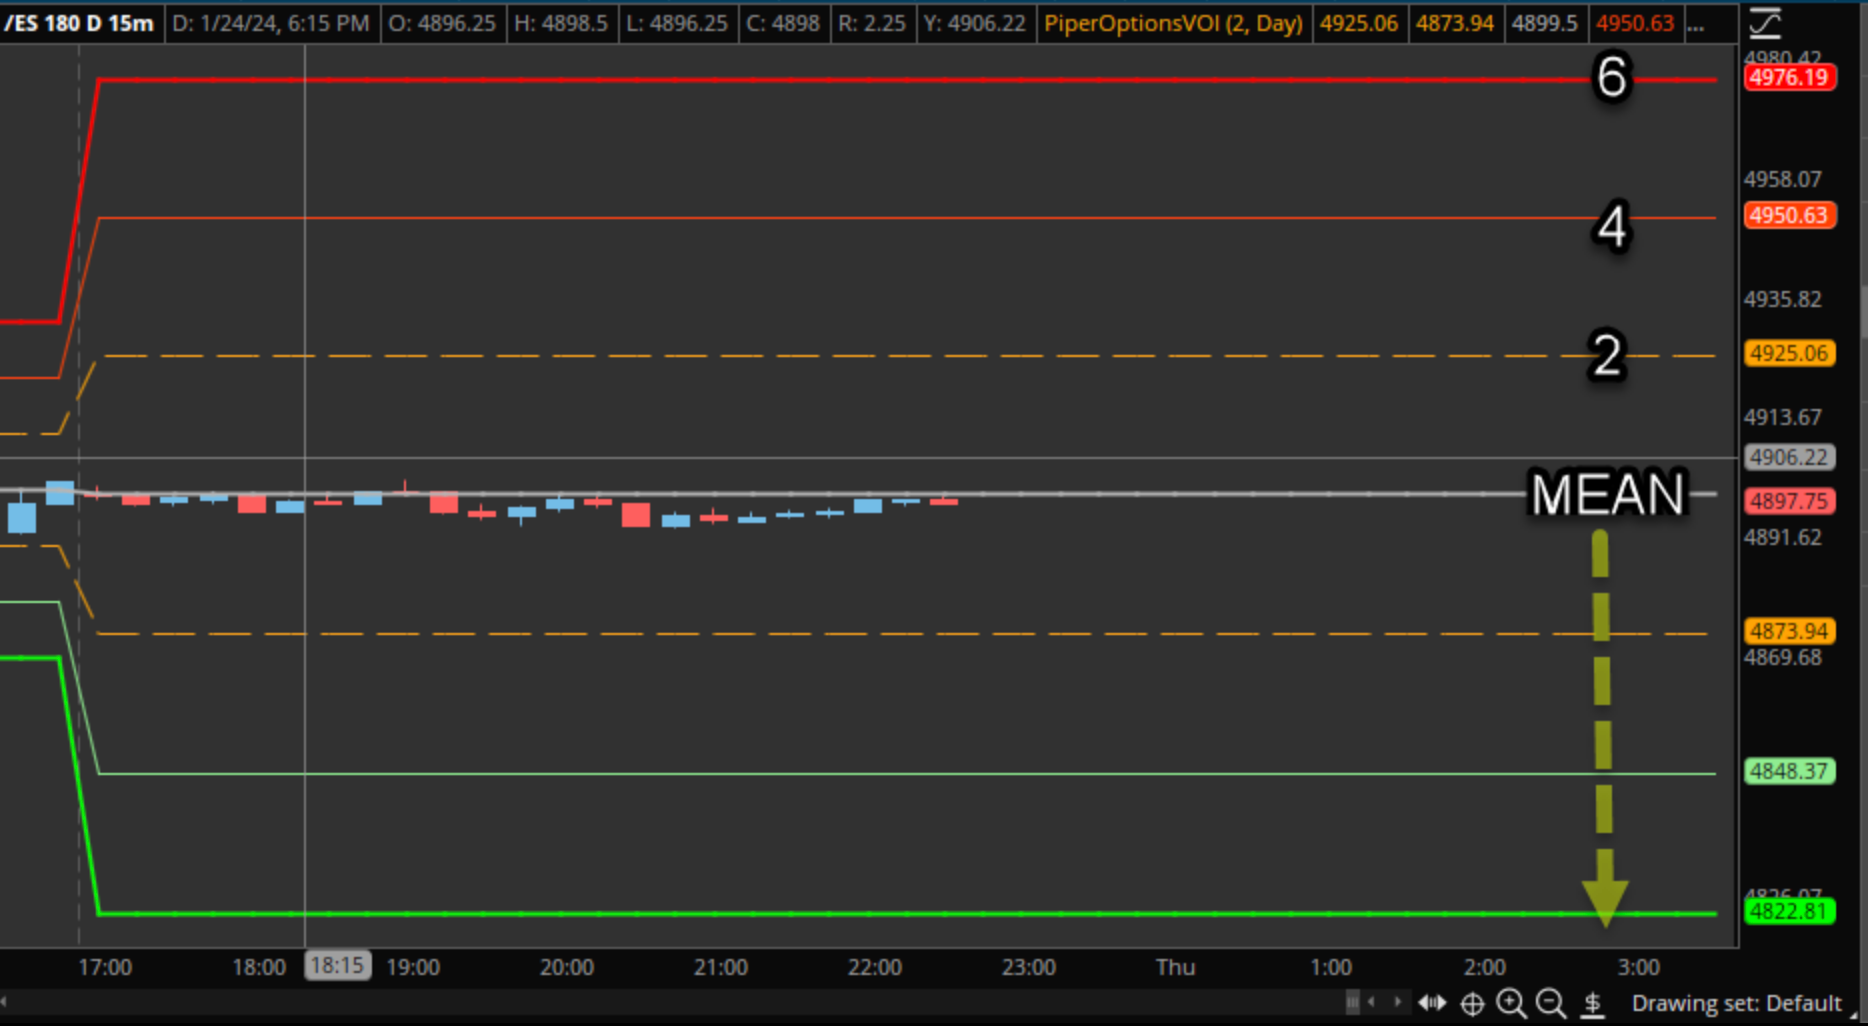
The Options VOL Mean (Centerline) — This is your baseline. It sits at the center of the chart and represents the options-derived mean price for the session. Everything else is measured from here.
The Deviation Lines — Extending outward from the mean in both directions, you’ll see lines at the 2nd, 4th, and 6th standard deviations. Three above the mean, three below. That gives you a total 6-deviation range that maps the entire expected price envelope for the day.
Each deviation level represents a progressively more extreme move from the mean. The further price pushes from the center, the more stretched it is relative to what the options market expects.
Where Price Typically Lives—and Where It Doesn’t
This is where the levels become incredibly practical.
Within the 2nd Deviation — Under typical market conditions, the ES generally operates within the first two deviations on either side of the mean. This is the normal range. Price will oscillate around the mean, push toward the 2nd deviation, and most sessions will live in this zone. For daily trades, the 2nd deviation lines are the levels I concentrate on most.
Approaching the 4th Deviation — On more volatile days, price may push out toward the 4th deviation. This is where things get interesting. When price reaches the 4th deviation, the market is telling you it has overextended relative to what the options data projected. This is a signal of overextension, and more often than not, a reversal becomes imminent around this area. If you see price approaching or touching the 4th deviation line, you should be actively looking for signs that the move is exhausting—not chasing it further.
The 6th Deviation — Reaching the 6th deviation is an exceptionally rare event. When it happens, it signals extraordinary conditions—think major news events, circuit-breaker-level moves, or true black swan sessions. You will rarely see price here, and when you do, you’ll know the day is anything but normal.
For my daily process, the 2nd and 4th deviations are the workhorses. The 2nd gives me the expected boundary of a normal session. The 4th tells me the market has gone too far and a snapback is likely.
The 90% Rule: A Stat That Should Change How You Think About Range
Here’s a piece of data that makes these levels invaluable, especially if you’re looking for a statistical edge.
Historical data shows that once price touches the 2nd deviation level on one side, there is a 90% probability that the market will not close beyond the opposite 2nd deviation. Let that sink in.
What does this mean practically? If the ES pushes up and tags the 2nd deviation above the mean early in the session, you now have a statistically backed expectation that the close will not be below the 2nd deviation on the downside. That’s an enormous piece of information for framing your session bias. It helps you establish directional expectations, manage your positions with more confidence, and avoid overtrading in the wrong direction.
This statistic is crucial in the early hours of the trading day. When price touches the 2nd deviation early, it immediately helps you establish a bias and guide your strategy for the rest of the session—unless an unexpected news event changes the calculus entirely.
How We Use These Levels in Practice
Just like the GEX levels I’ve written about separately, the Options Volatility Levels are not traded in isolation. You don’t see a 2nd deviation line and blindly enter a trade. That’s not how this works.
These levels serve two primary purposes in our daily process:
As Confluence — When a 2nd or 4th deviation line aligns with a key structural level, an untested level, or another area of significance that we’re already watching, the conviction in that level goes up substantially. You now have two completely independent data sets—your structural analysis and the options-derived volatility projection—pointing to the same price. That kind of alignment is exactly what we look for every single day.
As Targets — This is where the VOL levels truly shine. If you’re in a trade and price is progressing toward a deviation level, that level becomes a natural area to consider taking profits or tightening your management. The options market is projecting that this is how far the move is likely to extend. When price arrives there, you don’t need to guess whether to hold or fold—the data has already given you a roadmap.
As Reversal Signals — At the 4th deviation specifically, these levels become a warning system. If price has pushed to the 4th deviation, it’s overextended. The probability of continuation drops dramatically, and the probability of a reversal increases. This doesn’t mean you blindly fade the move, but it means you should be on high alert for any structural or price action confirmation that the move is done.

Putting It All Together: Your Daily Workflow
Here’s how to use the S&P Edge Options Volatility Levels when you open your trade plan each morning:
First, locate the Options VOL Mean. This is your anchor for the session. Know where the center of the expected range sits.
Second, identify the 2nd deviation lines above and below. These define the boundaries of a normal day. If price reaches one of them early, apply the 90% rule—expect the close to remain within the opposite 2nd deviation.
Third, note the 4th deviation lines. These are your overextension alerts. If price gets here, the move is stretched. Start looking for reversal setups rather than continuation.
Fourth, cross-reference these levels with your structural levels from the trade plan. Where do the VOL levels overlap with untested structure, prior balance edges, or key areas of interest? Those overlap zones are your highest-conviction areas for the session.
Fifth, use the deviation levels as targets for active trades. If you’re long and the 2nd deviation above sits ten handles away, that’s a natural profit objective. Let the data guide your management.
These levels are one more way we use tools to sharpen our edge. They don’t replace the process—they make it stronger. When you combine structural analysis, gamma exposure data, and options volatility projections, you’re looking at the market through multiple lenses, each reinforcing the other. That’s how you build conviction. That’s how you trade with confidence.
Until next time—trade smart, stay prepared, and together we will conquer these markets!
Ryan Bailey, VICI Trading Solutions.