
Gold Just Had Its Worst Month Since the 2008 Financial Crisis — Here’s What the Last 50 Years of Data Say Happens Next
Wall Street’s favorite trade of 2026 just imploded. But history has a message for anyone paying attention — and the numbers might surprise you.

If you’ve been watching gold this month, you’ve probably felt one of two things: confusion or pain. Maybe both.
I get it. A war is raging in the Middle East. The Strait of Hormuz is effectively closed. Oil is ripping above $110. Inflation expectations are surging. This is supposed to be gold’s moment. This is the exact environment where the world’s oldest safe haven is supposed to shine.
Instead? Gold just posted its worst month since October 2008 — down roughly 13% in March alone. That’s not a pullback. That’s a bloodbath. The last time we saw a monthly decline this severe, Lehman Brothers had just collapsed and the entire global financial system was in freefall.
And if you’re sitting there wondering “How is this possible?” — you’re asking the right question. Because the answer reveals something most traders and investors fundamentally misunderstand about gold. And the historical data that follows might just change how you think about this selloff entirely.
The Setup: How Wall Street’s Hottest Trade Fell Apart
Let’s rewind to January to understand how we got here.
Gold entered 2026 as the consensus darling of Wall Street. And honestly? The thesis was bulletproof — or at least it looked that way.
Gold had rallied 64.6% in 2025 — its best annual return since 1979.
By late January, spot gold reached an all-time high of $5,589 per ounce.
Central banks were buying hand over fist — China alone extended its purchasing streak to 16 consecutive months through February.
The dollar’s share of global FX reserves had fallen to its lowest level since 1994.
The narrative was clean: falling inflation, multiple Fed rate cuts on the horizon, and insatiable institutional demand.
Everyone was long. Everyone was bullish. And when everyone agrees on a trade — that’s exactly when it becomes most vulnerable.
Then came Operation Fury, the escalation with Iran, and the closure of the Strait of Hormuz. Oil surged. And instead of sending gold to the moon, it sent gold off a cliff.
The SPDR Gold Shares ETF (GLD) recorded over $8 billion in outflows during March — more than double its prior largest monthly withdrawal, which was set back in February 2021.
Read that again. More than double the previous record.
The Answer Isn’t Geopolitics — It’s Interest Rates
Here’s the part most people get wrong, and it’s the entire key to understanding this move:
Gold is not an outright war hedge. It is an interest-rate-sensitive asset.
I know that goes against everything you’ve been told. Gold is supposed to go up when the world falls apart, right? And sometimes it does — but only when the rate environment cooperates.
Here’s what actually happened: The Iran conflict reignited the very inflation pressures that markets had spent months assuming were behind them. Oil above $110 a barrel doesn’t just raise gas prices — it fundamentally changes the Fed’s calculus on monetary policy.
The rate cuts that underpinned gold’s historic 2025 bull run? They evaporated almost overnight.
At its March 18 meeting, the Fed held rates at 3.50%–3.75% and penciled in just one 25-basis-point cut for the rest of the year. That’s it. One cut. After markets had been pricing in multiple cuts just weeks earlier.
But traders went even further. Polymarket now assigns a 35% probability to zero cuts in 2026 — making that the single most likely outcome. And there’s a 20% chance of a rate hike.
Let that sink in. We went from “multiple cuts” to “we might actually be hiking” in the span of a few weeks. That is a violent repricing of expectations, and gold — a non-yielding asset whose entire 2025 rally was built on the assumption of falling rates — bore the full brunt of it.
The conflict didn’t kill gold. The inflation from the conflict killed the rate cuts, and that killed gold. There’s an important distinction there, and understanding it is what separates informed traders from the crowd.
So What Does History Say? This Is Where It Gets Interesting.
Now let’s get to the data — because this is where the real edge lives.
Double-digit monthly selloffs in gold are exceptionally rare. Since 1970, there have been only 11 such instances where gold dropped more than 10% in a single month. We’re talking about events so uncommon they happen roughly once every five years on average.
But here’s what the forward-return data shows — and this is the part that should have your full attention:
Historical Performance of Gold Following a >10% Monthly Drop
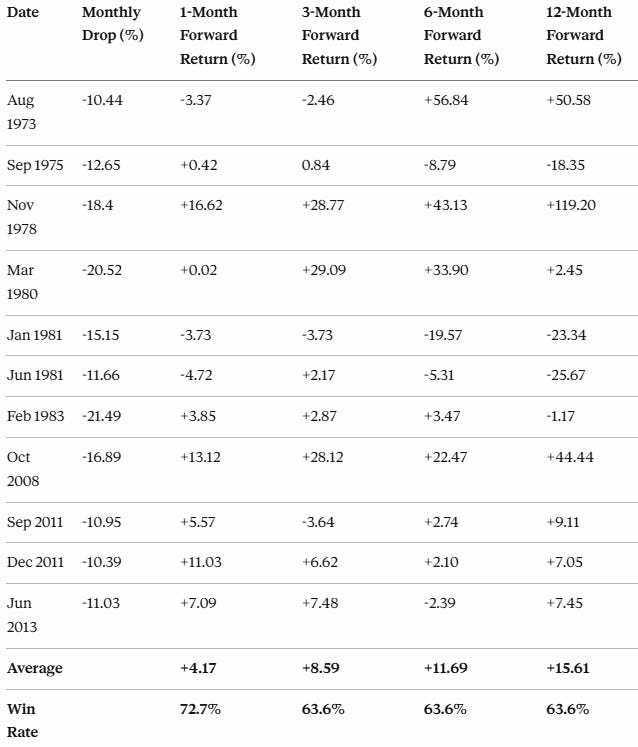
Data: TradingView
Read that bottom row carefully.
On average, gold gained 4.2% in the month following a double-digit selloff, 8.6% over three months, and 15.6% over twelve months. The win rate sits at roughly 73% at one month and holds steady at about 64% across all longer timeframes.
Those are not coin-flip odds. Those are edges.
The Nuance: Why This Isn’t a Guaranteed Buy Signal
Now — and this is critical — I’m not here to tell you to blindly back up the truck on gold tomorrow. That’s not how we operate. Data gives us probabilities, not certainties, and there are real risks embedded in this setup that deserve your attention.
The cautionary tale lives in the 1981 episodes. In January and June of 1981, gold suffered back-to-back double-digit monthly crashes that produced further losses of 23% to 25% over the following twelve months. What was different about 1981? Paul Volcker’s Fed was in the middle of one of the most aggressive rate-hiking cycles in modern history, with the fed funds rate exceeding 19%.
Sound familiar? Not exactly the same magnitude — but the directional parallel is worth noting. We’re in an environment where the Fed has gone from cutting to holding to potentially hiking. That’s the one macro configuration that has historically been able to suppress gold even during geopolitical chaos.
The question every gold trader needs to answer right now is: Are we in a February 1981 scenario, or is this more like October 2008 — a violent shakeout within a secular bull market?
What the Analysts Are Saying
For what it’s worth, here’s where the major institutional desks stand:
J.P. Morgan is maintaining its year-end 2026 target of $6,300 per ounce. They haven’t flinched.
Deutsche Bank stands behind $6,000. Also unmoved.
Goldman Sachs is holding a $5,400 year-end target, noting that central bank diversification and normalized speculative positioning support the longer-term case.
Bank of America technical analyst Paul Ciana sees gold in a wave-four consolidation phase — a corrective structure that could persist through Q2 and Q3 of 2026, with downside risk toward $4,000 near the rising 50-week moving average.
The structural foundations that powered the rally — central bank accumulation, de-dollarization, expanding fiscal deficits — haven’t changed. What has changed is the rate environment. And rate environments can shift faster than most people expect.
The Bottom Line
Here’s what I want you to take away from this:
Gold didn’t break because the world got safer. Gold broke because the inflation from a Middle Eastern war destroyed the rate-cut narrative — and gold is, at its core, an interest-rate asset.
History tells us that selloffs of this magnitude are rare, and the forward returns are skewed meaningfully to the upside. A 73% win rate at one month and average 12-month gains of 15.6% are not numbers to ignore.
But history also warns us that when real rates are rising aggressively — when the Fed is tightening into inflation rather than easing through it — gold can stay under pressure far longer than most bulls expect.
Watch the Fed. Watch oil. Watch rate expectations. Those three variables will tell you everything you need to know about whether this is a generational buying opportunity or a trap.
The data leans bullish. But the data also demands respect for the exceptions. Trade what you see, not what you hope for.
Until next time—trade smart, stay prepared, and together we will conquer these markets!
Ryan Bailey, VICI Trading Solutions.