
Chaos vs. Math: How Data Beat the “Greenland” Headline
Wednesday was insane. The news was wild. The volatility was huge. And yet... the stats hit 100%. Here is why I’m doubling down on Edgeful.

Team,
If you traded this past Wednesday, you know exactly what “chaos” looks like.
We had the Trump “Greenland” headlines hitting the tape. We had massive volatility spikes. We had a 75-point rip to the upside that looked like it was going to melt faces and leave the bears for dead.
In a normal environment, this is where technicals usually fail. Emotional traders get chopped up, news algorithms go haywire, and market structure breaks down.
But something incredible happened on Wednesday. The math held.
I want to share a specific story from this week that has completely solidified my conviction in Edgeful, and why I have gone so far as to reprogram my own trading setup because of it.
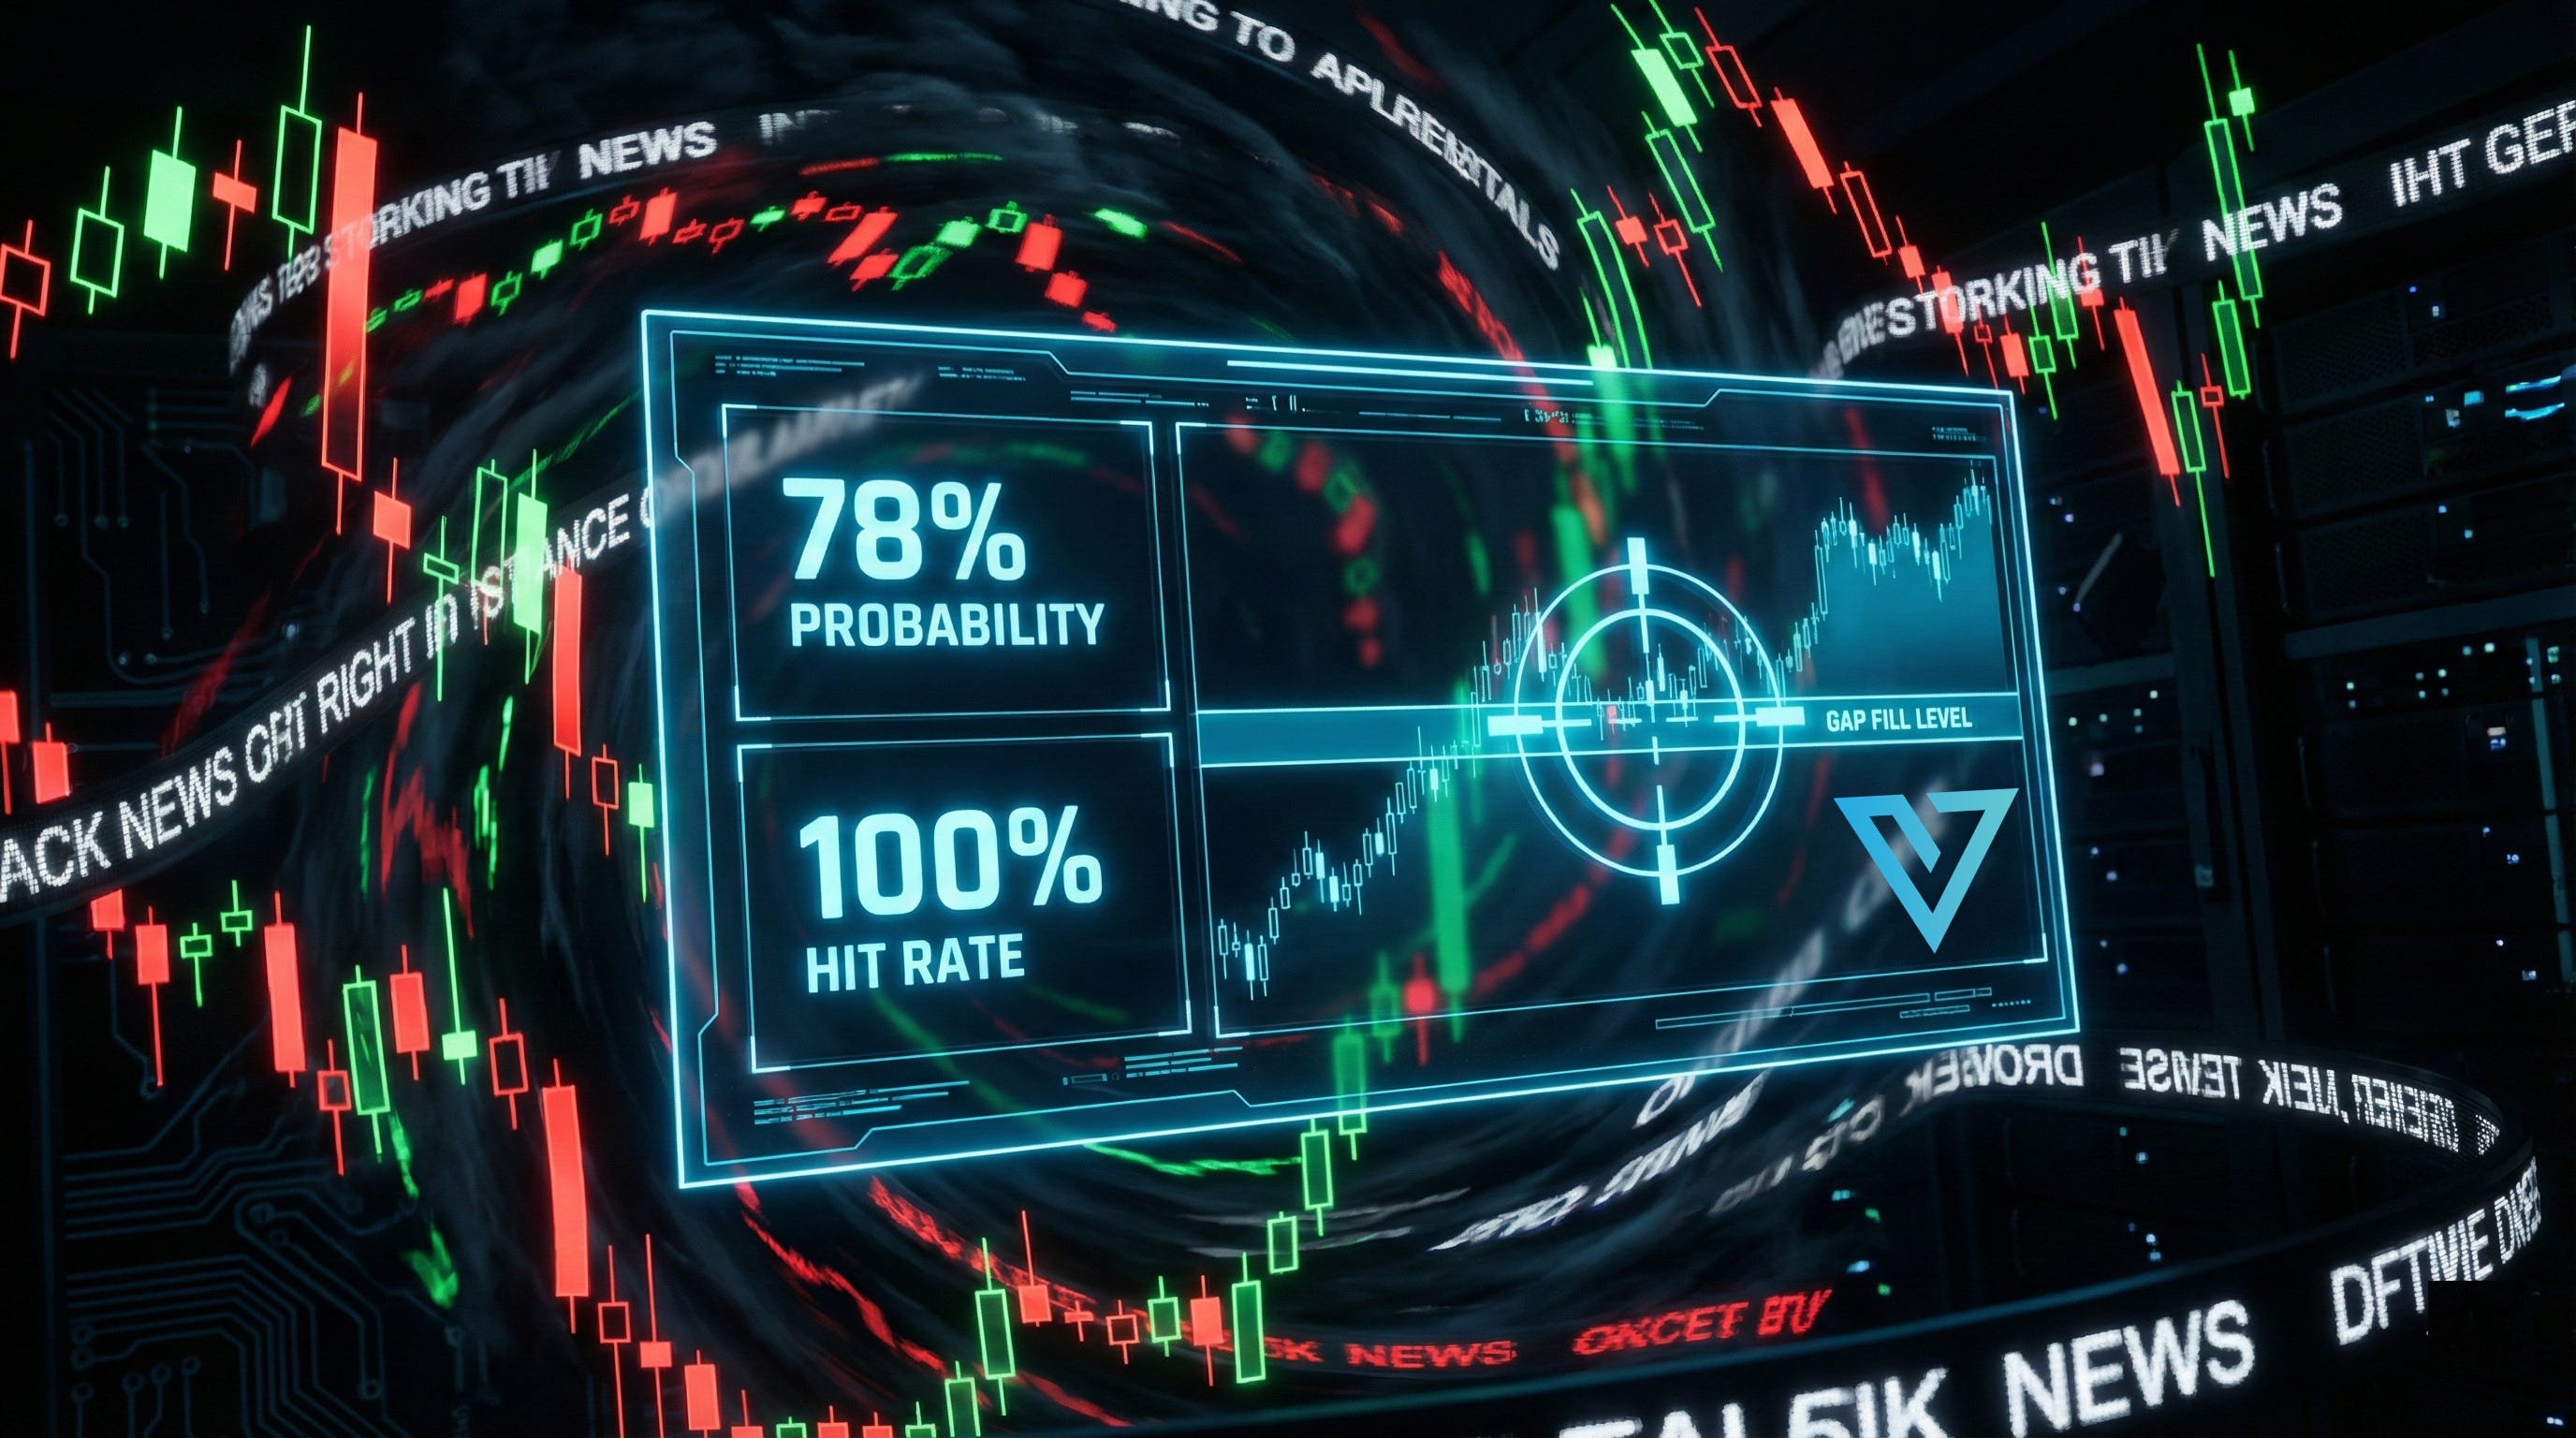
The Wednesday Case Study: 78% vs. The Rip
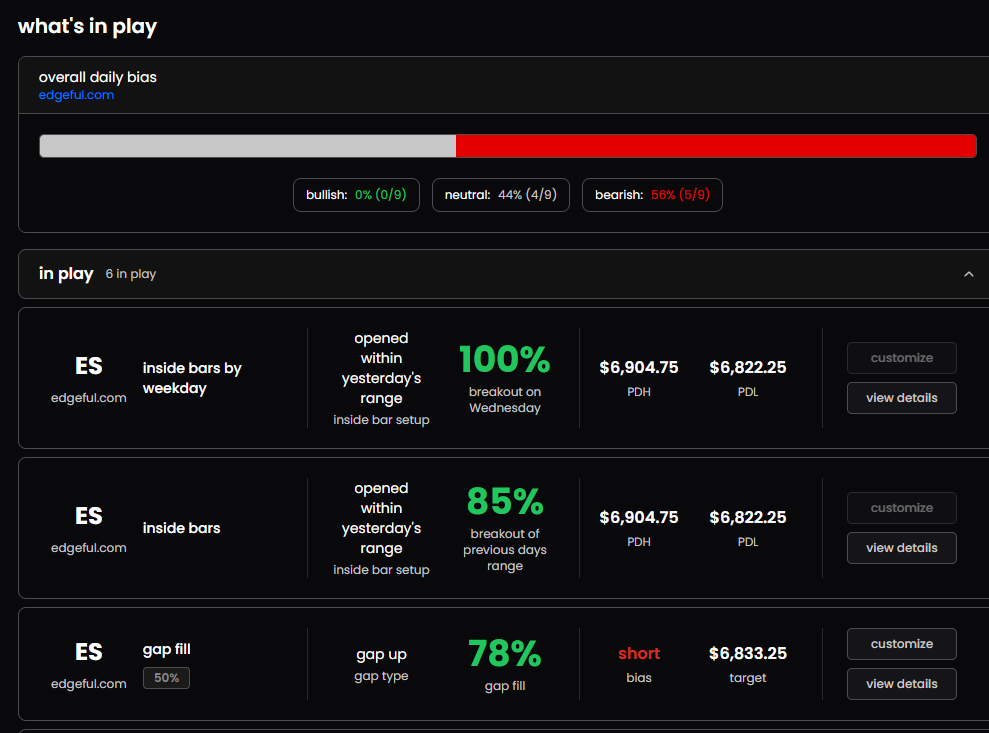
On Wednesday morning, the Edgeful dashboard (the “What’s In Play” tool) gave us a clear statistical roadmap:
Gap Fill Probability: 78% (Short Bias).
Inside Bar Breakout: 100% historical success rate on Wednesdays.
When the market ripped 75 points higher on the news, I’ll be honest—part of me thought, “Well, this is the 22% of the time the stat fails. The gap isn’t filling today.”
The momentum was insane. The headlines were flying.
But the data didn’t care about Greenland.
Despite that massive rip, price eventually rolled over, came all the way back down, and filled the gap exactly.
Every single statistic on the Edgeful dashboard hit. Every. Single. One.
This was a lightbulb moment for me. If these probabilities can hold up during a headline-driven volatility event like that, they can hold up through anything.
Going All In: Coding “The Edge” into Sierra Charts
I have fallen in love with these statistics so much that looking at the dashboard wasn’t enough for me anymore. I needed this data directly on my execution screen.
I spent time this week actually coding my own custom indicators for Sierra Charts based specifically on the Edgeful data points.
I took the historical fill targets, the breakout levels, and the probability zones, and plugged them directly into my system so they mark the levels automatically on my chart.
I wouldn’t spend hours coding custom tools for a product I was “on the fence” about. I did this because I realized that not having this data on my screen was a liability. I wanted to see the target and know, visually, “There is a 100% chance we touch this line today.”
(One Of My Edgeful Indicators Coded for Sierra Charts)
The “Partial Profit” Problem (And How This Fixed It)
We all struggle with the same demon: Selling too early.
You get a nice move, you see some green in your P&L, and you panic-sell a chunk of your position because you don’t want to lose it. It’s the “comfort zone” of taking partials.
But taking partials too early kills your Risk/Reward ratio.
Edgeful has been a game-changer for my conviction. When I open the dashboard and see a statistical bias that aligns with my technical analysis, it acts as a force multiplier for my patience.
It has forced me to hold size to target.
It is very difficult to panic-sell when you are looking at a dashboard that says “History says there is a 78% chance we go lower.” It gives you the conviction to sit on your hands, trust the math, and let the trade work.
It has moved me out of my comfort zone and into the “profit zone.”
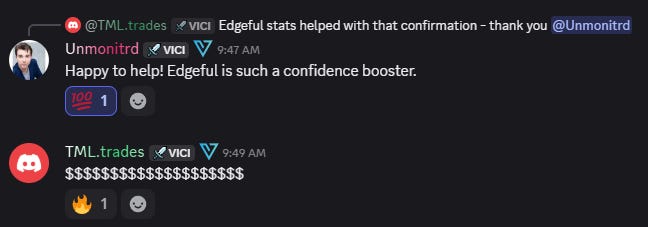
(A Real Conversation From Members in Team Vici Discord Using Edgeful Today!)
⚠️ URGENT: The Free Trial Is Ending
I have been telling you guys to try this out because I genuinely believe it is the best edge you can add to your trading for the price.
But you need to act fast.
I just got word that Edgeful is removing the 7-Day Free Trial option after February 1st.
After that date, the “try before you buy” option is gone.
If you have been waiting to test this out, do not wait any longer. You can still lock in the free trial right now by using the link below, giving you a full week to test the “What’s In Play” dashboard, see the stats for yourself, and watch the power of this system in real-time.
Don’t let the door close on a free look at the best data in the game.
👇 CLAIM YOUR 7-DAY FREE TRIAL BEFORE FEB 1ST 👇
>> CLICK HERE to Start Your 7-Day FREE Trial <<
Let’s keep trusting the data, holding to our targets, and conquering these markets.
Ryan Bailey
VICI Trading Solutions